
Participants
The present study was conducted in six secondary schools in the province of Almería (Spain), with students in the 2nd, 3rd and 4th years of Compulsory Secondary Education. The participants ranged in age from 12 to 17 years (M = 14.15, SD = 1.11). Initially, the sample included 1,280 adolescents; however, 188 were excluded after data processing due to incomplete attendance to sessions, language difficulties, or random test responses, resulting in a final valid questionnaire rate of 87.01% and a response rate of 98.05% (see Fig. 2). The final sample consisted of 1,092 students, all originally from Spain. Of these, 53.44% (n = 584) were female (Mage = 14.14, SD = 1.04) and 46.56% (n = 508) were male (Mage = 14.17, SD = 1.17). The sample distribution by academic year of secondary education was as follows: 2nd year (n = 400; 194 males, 206 females), 3rd year (n = 342; 143 males, 199 females), and 4th year (n = 350; 171 males, 179 females).
Fig. 2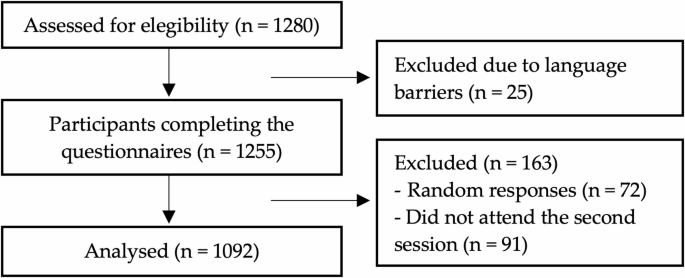
Flowchart of the final sample selection process
To ensure the representativeness of the sample, an estimation was conducted based on a population of 38,180 adolescents aged 12 to 16 years from the province of Almería (Spain). Using a 95% confidence level and a 3% margin of error, the minimum required sample size was calculated to be 1,039 participants. The final sample recruited for the study comprised 1,092 students, thus meeting criteria for population representativeness. Moreover, this sample size was sufficient in terms of statistical power, given that mediation analyses were conducted using a bootstrap approach with coefficients estimated from 5,000 bootstrap samples. The standardized coefficients for indirect effects ranged from − 0.13 to − 0.31 in the psychological well-being model, and from − 0.04 to − 0.20 in the social well-being model (with the exception of social acceptance, whose indirect effect was not statistically significant). Based on the simulations by Fritz and MacKinnon [63], detecting small indirect effects (a × b ≈ 0.02) with a statistical power of 0.80 [64] using bootstrap methods would require a sample size between 462 and 558 participants. Therefore, considering our sample exceeded 1,000 participants and observed indirect effects were greater than 0.04, it can be reasonably inferred that the statistical power surpassed the 80% threshold for most effects examined.
MeasuresAcademic burnout
Maslach Burnout Inventory – Student Survey (MBI-SS; Maslach et al., [43]; validated in Spanish adolescent students by (Pérez-Fuentes et al., 2020) [44]. This study employed the Spanish-adapted version of the Maslach and Jackson [65, 66] Burnout Scale for adolescents, which demonstrated good reliability (ω = 0.86). The scale is designed to assess students’ feelings and attitudes toward their academic activities by measuring burnout based on its frequency and intensity. It consists of 12 items rated on a 7-point Likert scale (from 0, “Never”, to 6, “Always/Every day”). The scale is divided into three subscales: (1) Emotional exhaustion (ω = 0.83), with items such as “I feel emotionally drained by my studies’’; (2) Cynicism (ω = 0.85), including items like ‘’I have become less enthusiastic about my studies’’; and (3) Academic efficacy (ω = 0.81), featuring items such as ‘’In my opinion, I am a good student’’.
Psychological well-being
Psychological Well-Being Scale (PWB; Ryff [5],; Spanish adaptation and validation by Díaz et al., 2006). Based on the Ryff model of eudaimonic well-being that encompasses six separate dimensions, this study used a Spanish-adapted version, which demonstrated a reliability of ω = 0.92. The scale consists of 39 items rated on a 6-point scale (from “Strongly disagree” to “Strongly agree”). Illustrative items are provided for each dimension: (1) Self-Acceptance (ω = 0.84), measured through six items such as “In general, I feel confident and positive about myself”; (2) Positive Relationships (ω = 0.76), assessed through six items like “I don’t have many people who want to listen to me when I need to talk”; (3) Autonomy (ω = 0.70), measured with eight items, e.g., “I tend to worry about what other people think of me”; (4) Environmental Mastery (ω = 0.65), assessed through six items like “In general, I feel that I am responsible for the situation in which I live”; (5) Personal Growth (ω = 0.63), using seven items, e.g., “I find it difficult to try to make major improvements or changes in my life”; and (6) Purpose in Life (ω = 0.80), measured with six items, such as “I am not clear about what I am trying to achieve in life”. This instrument evaluates psychological well-being across multiple domains, with items such as “Are important decisions made together as a family?”.
Social well-being
Keyes Social Well-Being Scale (SWB; Keyes [37],; Spanish adaptation and validation by Blanco & Díaz [67],. Confirmatory factor analyses conducted by these authors supported the five-factor model of social well-being. This scale demonstrated good reliability for this study (ω = 0.86). The scale consists of 25 items designed to evaluate individuals’ perceptions of various aspects of their social environment that contribute to psychological well-being. It encompasses five specific dimensions of social well-being: (1) Social Integration (ω = 0.72), assessed by five items such as “I feel that I am an important part of my community”; (2) Social Acceptance (ω = 0.85), with six items like “I think people are not to be trusted”; (3) Social Contribution (ω = 0.73), measured by five items such as “I think I can contribute something to the world”; (4) Social Actualization (ω = 0.66), assessed by five items like “I see that society is continuously developing”; and (5) Social Coherence (ω = 0.68), measured by four items such as “The world is too complex for me”. Responses are rated on a 5-point Likert scale, ranging from 1 (“Strongly disagree”) to 5 (“Strongly agree”), providing a comprehensive assessment of the extent to which individuals perceive these aspects in their social environment.
Optimism
Optimism–Pessimism Questionnaire [68]. It demonstrated a reliability of ω = 0.78 and consists of 9 items, such as “I have confidence in the future”. It has a 5-point Likert scale, ranging from 1 (“Strongly disagree”) to 5 (“Strongly agree”). The overall score is calculated by summing the responses across all items, providing a comprehensive measure of the adolescent’s level of optimism.
Sociodemographic information
A specific ad hoc questionnaire was designed to collect sociodemographic information from the students, including age, sex, educational level, and country of origin. In addition, the survey explored other variables related to the school environment, academic performance, the presence of violent behaviors, and personal interactions with key figures in their immediate environment, such as parents, legal guardians, teachers, and peers.
Procedure
Several Compulsory Secondary Education centers in the province of Almería were randomly selected and contacted. Initial communication was established with the individuals responsible for each center, either the administration department or school office. Ultimately, six schools agreed to participate, and data collection took place during the 2023/24 academic year.
During the initial contact with the secondary schools, the key details of the research and its specific objectives were shared with those in charge, along with all the necessary information to facilitate data collection. They were also provided with the questionnaire booklet that would later be administered to the students.
The schedules were organized based on each school’s availability, allocating two hours per group per week over a period of two weeks to minimize fatigue and enhance performance. The questionnaire included a designated stopping point labeled “End of session 1” to guide students on where to pause. After obtaining permission from the schools and informed consent from parents, data collection started. To maintain anonymity and ensure continuity between sessions, students created an anonymous personal code using an easy-to-remember pattern, which they recorded on the first page of the booklet at the initial session.
The sessions began with an explanation of the study’s objectives and detailed instructions for completing the questionnaires individually. Students were assured that their privacy would be protected through confidential statistical processing, and it was emphasized that participation was voluntary, anonymous, and confidential. No costs were incurred for participation, and no financial compensation was provided. The research was approved by the Bioethics Committee of the University of Almería (reference: UALBIO2020/046).
Data analysis
This cross-sectional study employed a quantitative, descriptive, and correlational approach. Data were analyzed and processed using IBM SPSS Statistics for Windows, Version 29 (IBM Corp., 2023) [69]. To assess the reliability of the data collection instruments, McDonald’s omega coefficient (1999) [70] was calculated, following the guidelines recommended by Ventura-León & Caycho [71].
First, correlational and descriptive analyses of the study variables were conducted. Pearson’s correlation coefficient was used to assess the relationships between variables. To interpret the magnitude of the correlations, Cohen’s (1988) guidelines were followed, where: rxy xy xy strong correlation.
To identify different profiles based on the scores in the dimensions of academic burnout, a two-stage cluster analysis was performed. Once the groups or clusters were identified, a comparative analysis of means for optimism and psychological and social well-being was conducted using Student’s t-test for independent samples, and Cohen’s d statistic (1988) to determine the effect size of the observed differences.
Finally, simple mediation analyses were conducted using the level of academic burnout (low/high), as determined by the clusters, as the predictor variable, and optimism as the mediating variable. The response variables were the dimensions of psychological well-being and social well-being, respectively. Mediation models were computed using the PROCESS macro for SPSS [72], applying the bootstrapping technique with estimated coefficients from 5000 bootstrap samples.