
Study selection
Out of four databases, the present systematic review found 327 possibly related articles. At each stage of the selection process, the number of studies that were included and excluded is displayed in detail in Fig. 1.
Fig. 1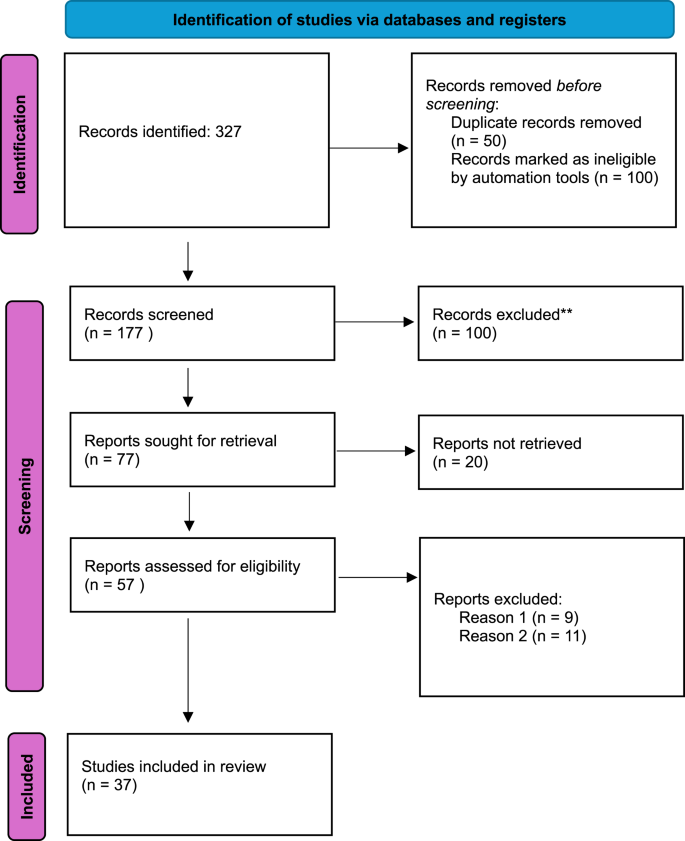
Several full-text articles were excluded for well-justified reasons to ensure methodological rigor and alignment with the review’s objectives. Specifically, out of the 57 articles assessed for eligibility, 9 articles were excluded for failure to meet the predefined inclusion criteria regarding the target population, the type of intervention, or the outcomes assessed (Reason 1) and 11 for insufficient or incomplete data reporting, which prevented reliable data extraction and synthesis (Reason 2).
Study characteristics
Among the population studies, 37 research articles were finally included, totaling 1,599,322 children and adolescents, diagnosed with MDs by DSM or ICD, from all continents Asia, America, Australia, Europe, and Africa. 10 studies were conducted in Asia and included 66,033 participants. Among the included countries in Asia, 6 studies were conducted in China, 2 in Nepal, 1 in Malaysia, 1 in Indonesia, and 1 in Ardabil. 14 studies were retrieved concerning primary research conducted in America and Australia, and a total of 101,038 participants were included. In Europe a total of 10 studies were included with 1,419,121 participants. The studies concerning Africa included an overall number of 3,145 participants. The study characteristics of all included studies are summarized in Table 3. Where multiple prevalence rates were reported (e.g., by gender or age group), the most representative or highest quality estimates were selected. Risk factors include sociodemographic, familial, and contextual variables significantly associated with the presence of mental disorders. This summary allows for an overview of methodological consistency and population diversity across the included studies.
Table 3 Summary of included study characteristicsMeta-analysis of prevalence estimatesAsia
The pooled prevalence of MDs estimate was 14.53% (SE = 0.0241, 95% CI [9.81%, 19.24%]), which was statistically significant (z = 6.04, p 2 = 99.76%, τ2 = .0057, H2 = 424.19), and the Q-statistic confirmed the presence of significant heterogeneity (Q (9) = 2357.55, p 2.
Fig. 2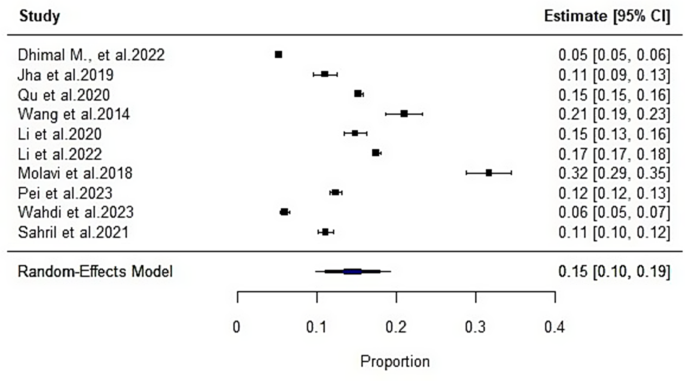
Forest plot of the meta-analysis for the Asian countries
Also, publication bias was assessed using Egger’s regression and Kendall’s rank correlation tests. Egger’s test showed no significant asymmetry (t (8) = 1.59, p = .151), and Kendall’s tau also suggested no evidence of publication bias (τ = 0.20, p = .484). The next figure represents the forest plot of the meta-analysis concerning the countries in Asia. Data are given in Fig. 3.
Fig. 3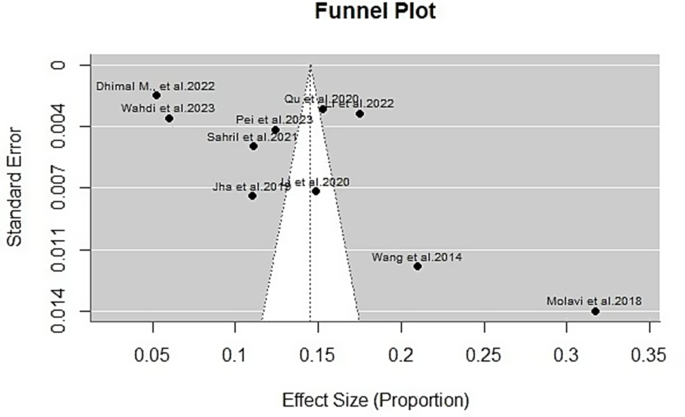
Funnel plot of the meta-analysis for the Asian countries
America and Australia
A random-effects meta-analysis was conducted using the restricted maximum likelihood (REML) estimator across 14 studies examining the prevalence of psychiatric disorders in children and adolescents across American and Australian populations. The pooled prevalence estimate was 30.64% (SE = 0.0675, 95% CI [17.41%, 43.87%]), which was statistically significant (z = 4.54, p 2 = 99.95%, τ2 = 0.0637, H2 = 2192.51), and the Q-statistic confirmed the presence of significant heterogeneity (Q (13) = 15632.48, p 4.
Fig. 4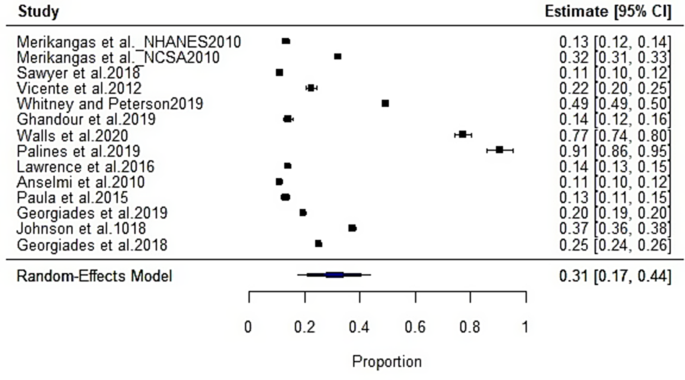
Forest plot of the meta-analysis for the American and Australian countries
In addition, publication bias was assessed using Egger’s regression and Kendall’s rank correlation tests. Egger’s test showed no significant asymmetry (t(12) = −1.37, p = 0.197), and Kendall’s tau also suggested no evidence of publication bias (τ = .27, p = .193). The funnel plot is given in the next figure (Fig. 5).
Fig. 5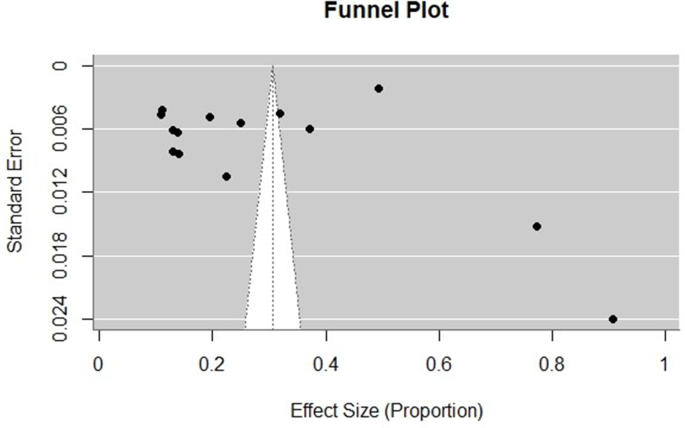
Funnel plot of the meta-analysis for the American and Australian countries
Europe
The random-effects meta-analysis was conducted across 10 studies examining the prevalence of psychiatric disorders in 1,419,774 children and adolescents across European populations. The pooled prevalence estimate was 30.44% (SE = 0.0754, 95% CI [15.68%, 45.21%]), which was statistically significant (z = 4.04, p 2 = 99.99%, τ2 = 0.0566, H2 = 18524.21), and the Q-statistic confirmed the presence of significant heterogeneity (Q (9) = 32114.43, p 6.
Fig. 6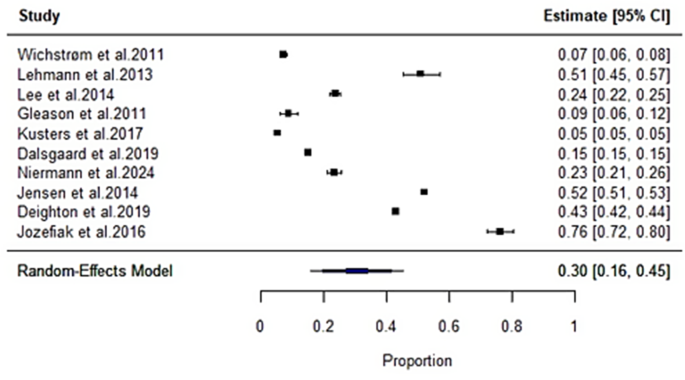
Forest plot of the meta-analysis for the Εuropean countries included in the present study
Publication bias was assessed using Egger’s regression and Kendall’s rank correlation tests. Egger’s test showed no significant asymmetry (t(8) = 0.88, p = 0.406), and Kendall’s tau also suggested no evidence of publication bias (τ = −0.07, p = 0.862). The next figure (Fig. 7) represents the funnel plot obtained from the results.
Fig. 7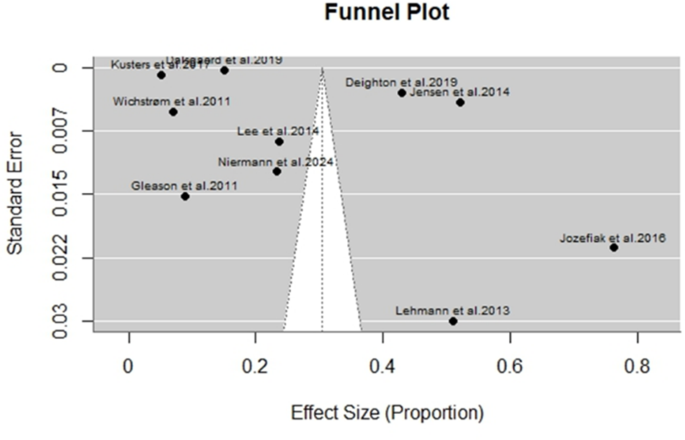
Funnel plot of the meta-analysis for the Εuropean countries included in the present study
Africa
The meta-analysis of the studies concerning Africa showed a pooled prevalence estimate of 9.86% (SE = 0.0123, 95% CI [7.44%, 12.27]), which was statistically significant (z = 7.99, p 2 = 78.83%, τ2 = 0.0004, H2 = 4.72), and a significant Q-statistic supported the presence of heterogeneity (Q (2) = 8.29, p = 0.016). The forest plot obtained from this analysis is given in the next figure (Fig. 8).
Fig. 8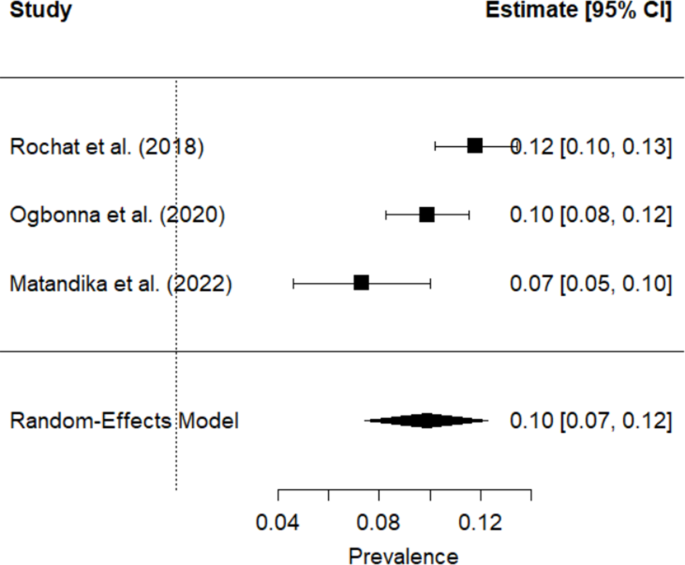
Forest plot of the meta-analysis for the African countries included in the present study
Publication bias was assessed using Egger’s regression test and Kendall’s rank correlation. Egger’s test was not significant (t(1) = −1.64, p = 0.349), and Kendall’s tau also indicated no evidence of funnel plot asymmetry (τ = −1.00, p = 0.333). Thus, there was no significant indication of publication bias. The funnel plot of the data is depicted in Fig. 9.
Fig. 9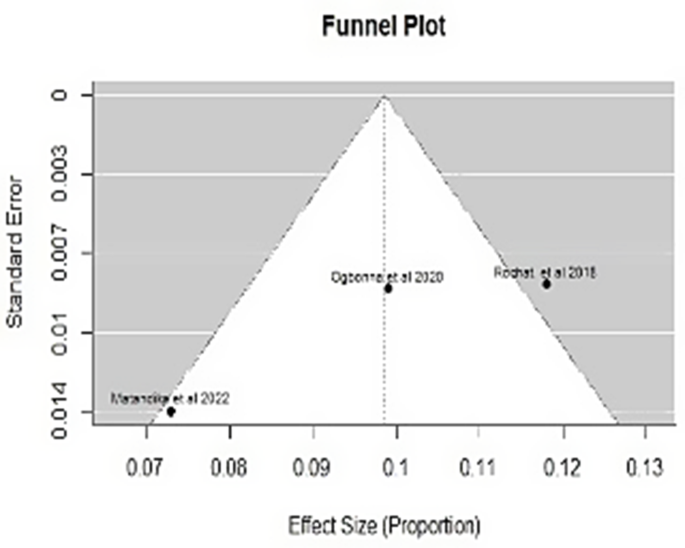
Funnel plot of the meta-analysis for the African countries included in the present study
Quality assessment
The results of the quality assessment using the two different tools, the Joanna Briggs Institute (JBI) Critical Appraisal Tool and the GRADE tool, are given in Table 4.
Table 4 Quality assessment of the included studies using the JBI and GRADE tools
Assessing the methodological quality of the included studies using JBI revealed that 36 out of 37 studies included were rated as having low to moderate risk of bias, while only one had high risk of bias. Moreover, the GRADE approach used to evaluate the certainty of the evidence for the main outcomes demonstrated moderate to high certainty, indicating a reasonable level of confidence in the synthesised results.
Sensitivity analysis was carried out by removing lower-quality studies that were identified as high risk of bias according to the JBI tool, in Asia, America, Australia and Europe; however, this was not feasible in the African region due to the limited number of included studies from that continent, which did not allow for meaningful re-analysis. The pooled prevalence estimates remained stable after exclusion, further supporting the reliability and robustness of the main findings.
Asia
A sensitivity analysis was performed by sequentially excluding studies with high or moderate risk of bias according to the JBI tool. After removing Jha et al. [33], Dhimal et al. [28], and Molavi et al. [34], the pooled prevalence estimate for MDs in children and adolescents across Asia was 13.96% (SE = 0.0180, 95% CI [10.43%, 17.49%]), indicating slightly lower and more precise estimates. The heterogeneity decreased (I2 = 99.34%, τ2 = 0.0022), although it remained substantial, suggesting persistent true variability across studies. Importantly, publication bias was not detected (Egger’s test: p = 0.9440; Kendall’s τ = −0.048, p = 1.000), further supporting the robustness of the findings.
America & Australia
To assess the robustness of the findings, a sensitivity analysis was conducted by excluding the study by Johnson et al. [42], which was rated as moderate risk of bias with a moderate GRADE level. The resulting pooled prevalence remained stable at 30.14% (SE = 0.0727, 95% CI [15.89%, 44.39%]), consistent with the original estimate of 30.64%. Although heterogeneity remained high (I2 = 99.96%, τ2 = 0.0686), the consistency of the pooled estimate supports the reliability of the overall findings. Publication bias was not indicated by Egger’s test (p = 0.193) or Kendall’s tau (p = 0.164), reinforcing confidence in the validity of the results.
Europe
To test the robustness of the European studies, a sensitivity analysis was conducted by excluding three studies [52, 58]; and [55]) that were rated as moderate risk of bias. The revised pooled prevalence estimate was 38.15% (SE = 0.0918, 95% CI [20.15%, 56.16%]), slightly higher than the original 30.44%, but within a statistically consistent range. Heterogeneity remained extremely high (I2 = 99.98%, τ2 = 0.0588), indicating that variability in prevalence persists across studies. No evidence of publication bias was observed (Egger’s test: p = 0.130; Kendall’s tau: p = 1.000). These findings suggest that the overall result is robust, and no single study disproportionately influenced the pooled estimate.
Subgroup and metaregression analysis
To seek answers on the high heterogeneity, we fitted random-effects meta-analyses on the logit of proportions (PLO) with REML estimation. All prevalence estimates and CIs are reported after inverse-logit back-transformation to the proportion scale (0–1), presented as percentages for readability. Heterogeneity statistics (τ2, τ, I2, H2, Q) were computed on the transformed scale.
Asia
A random-effects meta-analysis of six Asian studies (k = 6 [26,27,28,29, 32 and 33]) estimated the pooled prevalence of psychiatric disorders in children and adolescents at 13.0% (95% CI [9.1%, 18.3%]), corresponding to approximately one in eight youths. Heterogeneity was extremely high (I2 = 99.6%, Q(5) = 1783.05, p p = 0.474). This indicates that study quality, at least as rated by the JBI tool, does not account for observed variability. A subgroup analysis indicated that among the different diagnostic tools, only the K-SADS showed a statistically significant positive effect (estimate = 16.46, SE = 7.02, Z = 2.5, p = 0.019, 95%CI: 2.71–0.21). A meta-regression using midpoint age suggested a non-significant downward trend in prevalence with increasing age (b = −0.0271, p = 0.085). Estimated prevalence decreased from 15.8% in younger cohorts (≈10 years) to 10.5% in older cohorts (≈20 years). While not statistically conclusive, this pattern suggests that younger samples may show slightly higher prevalence, possibly reflecting developmental vulnerabilities or methodological factors (e.g., parental vs. self-report). Age explained about 29% of heterogeneity (R2 = 28.6%), suggesting some explanatory power but leaving most heterogeneity unaccounted for. In summary, psychiatric disorder prevalence among Asian youth is estimated at around 13%, with extremely high heterogeneity that cannot be explained by study quality or age alone. This indicates the presence of other sources of variability (e.g., diagnostic tools, cultural differences in symptom reporting, or study contexts) that future research should investigate.
America and Australia
A random-effects synthesis of 10 studies [38, 40,41,42,43,44,45,46,47,48, 62] from America and Australia estimated a pooled prevalence of 5.1% (95% CI [4.1%, 6.1%]) for psychiatric disorders in children and adolescents. Between-study heterogeneity was moderate to high (I2 = 84.3%), and the Q-test indicated significant dispersion around the mean (Q(9) = 69.97, p p = 0.716). Back-transformed subgroup estimates were similar, at 5.5% in low-risk studies and at 5.0% in moderate/high-risk studies, indicating that design quality, as rated by JBI, does not explain the between-study variance. A subgroup analysis indicated that the most diagnostic tools detected significantly fewer cases compared to the intercept. Specifically, DSM-IV (estimate = −1.25, SE = 0.36, Z = −3.51, p = 0.0004, 95% CI: −1.94 to −0.55), DISC-IV (estimate = −1.66, SE = 0.42, Z = −3.93, p p = 0.007, 95%CI: −0.04 to −0.01), and K-SADS-PL (estimate = −1.89, SE = 0.07, Z = −26.14, p p = 0.813) and no practical change in predicted prevalence across typical adolescent ages after back-transformation, suggesting that age does not account for the residual heterogeneity in these samples. The moderator R2 was 0%.
Europe
A random-effects meta-analysis of six European studies (k = 6 [50, 53, 55,56,57,58]) estimated the pooled prevalence of psychiatric disorders in children and adolescents at 29.6% (95% CI [18.0%, 46.5%]), indicating that nearly one in three European youths meet diagnostic criteria. Heterogeneity was extremely high (I2 = 99.9%, Q(5) = 1168.61, p p = 0.617), suggesting that study quality did not explain heterogeneity. However, subgroup analysis revealed that ICD-9 (estimate = −2.93, SE = 0.02, Z = −168.85, p p p 2 = 78.7%), making it the primary driver of heterogeneity in European studies.