
Study design and population
This cross-sectional study utilized data from the 2007–2018 National Health and Nutrition Examination Survey (NHANES), conducted by the U.S. Centers for Disease Control and Prevention (CDC).The NHANES program is designed to assess the health and nutritional status of the non-institutionalized U.S. population using a stratified, multistage probability sampling method [17].Data collection in NHANES involves structured household interviews, physical examinations in mobile examination centers, laboratory testing, and health-related questionnaires.NHANES data are publicly available at the NHANES website (http://www.cdc.gov/nchs/nhanes.htm) [18].
Figure 1 presents the flowchart of participant selection.Among the 59,842 participants in NHANES, we first excluded male participants (N = 29,629).Next, individuals with missing data on parity, depressive symptoms, or sleep duration were excluded (N = 15,096).We further excluded participants who were pregnant at the time of the survey (N = 453), as well as those with missing data on key covariates, including marital status (N = 8), educational level (N = 12), body mass index (N = 142), and alcohol consumption (N = 9).A total of 14,493 female participants were included in the final analysis.
Fig. 1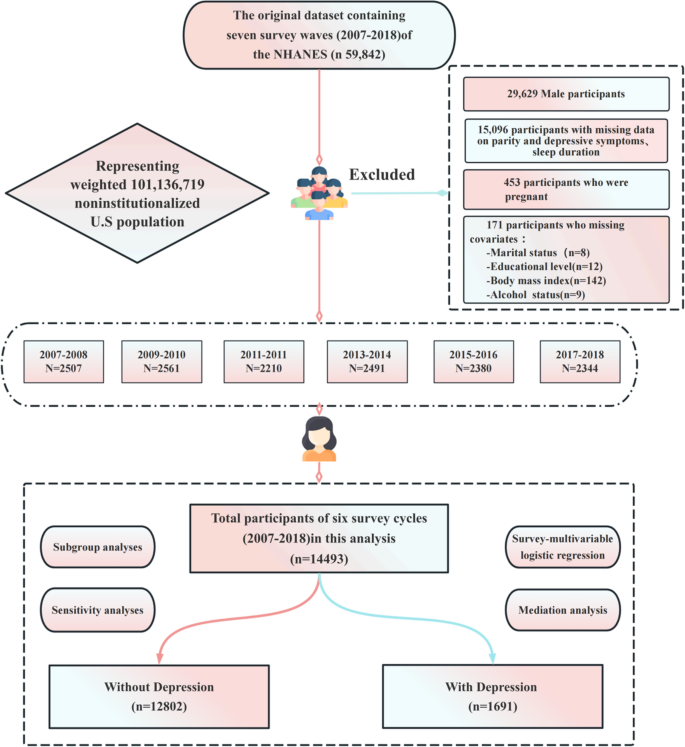
Flowchart illustrating the enrollment process of National Health and Nutrition Examination Survey (NHANES) 2007–2018 participants
Ethical approval and consent to participate
The NHANES study protocol was approved by the Ethics Review Board of the National Center for Health Statistics (NCHS).Written informed consent was obtained from all adult participants prior to data collection. For participants under the age of 18, consent was obtained from a parent or legal guardian.According to NHANES ethical review guidelines, secondary analyses of publicly available data do not require additional Institutional Review Board (IRB) approval (https://www.cdc.gov/nchs/nhanes/about/erb.html) [19].
Data on parity
Self-reported data on parity were obtained from the Reproductive Health Questionnaire (RHQ) in NHANES. The relevant questions were administered by trained interviewers at the Mobile Examination Center (MEC) using a computer-assisted personal interviewing system. Specifically, participants were asked two questions related to parity: “RHQ131: Have you ever been pregnant?” and “RHQ171: How many of your pregnancies resulted in a live birth?”Participants who responded to both questions were included in the analysis. Responses to RHQ171 ranged from 0 upwards, indicating the total number of deliveries resulting in live births, rather than the number of live-born infants [9]. Participants who answered “No” to RHQ131, indicating they had never been pregnant, were categorized as having zero parity. Responses of “Refused” or “Don’t know” were treated as missing data.
Outcome assessment
Depressive symptoms were assessed using the 9-item Patient Health Questionnaire (PHQ-9), administered by trained interviewers at the Mobile Examination Center (MEC). The PHQ-9 evaluates the frequency of depressive symptoms over the past two weeks through self-report, with response options ranging from 0 (“not at all”) to 3 (“nearly every day”), yielding a total score ranging from 0 to 27. Higher scores indicate more severe depressive symptoms [20]. In accordance with previous studies, participants with a PHQ-9 score of ≥ 10 were classified as having depressive symptoms. This cut-off has demonstrated a sensitivity and specificity of 88% for identifying major depressive disorder [21].
Assessment of Mediator – Sleep duration
Sleep duration was assessed based on participants’ responses to the question: “How much sleep do you usually get at night on weekdays or workdays?” [15].
Covariates
Based on previous literature, a range of covariates were included in the analysis of the NHANES data [9, 13, 15]. These covariates included age, race/ethnicity (non-Hispanic White, non-Hispanic Black, Mexican American, and other races), marital status (married, living with partner, living alone), educational level (12 years), smoking status (never smoker, former smoker, current smoker), alcohol consumption (drinker, non-drinker), physical activity, history of chronic diseases (hypertension, diabetes, and cardiovascular disease [CVD]), and body mass index (BMI).
Statistical analysis
Given the complex multi-stage stratified sampling design employed by the National Health and Nutrition Examination Survey (NHANES), sampling weights provided by NHANES were incorporated into all analyses in this study. Design-adjusted standard errors were calculated by specifying both the stratum variable (SDMVSTRA) and the primary sampling unit variable (SDMVPSU), thereby ensuring the national representativeness of the study findings. Regarding weight processing, the two-year mobile examination center (MEC) examination weight (WTMEC2YR) was used, and the weights for the six survey cycles were adjusted using the formula 1/6 × WTMEC2YR.Because the percentage of missing data was small, no imputation was performed.Participants were stratified by parity (number of live births) into three groups: 0, 1–3, and > 3.Categorical variables were presented as frequencies (percentages), while continuous variables were reported as means with standard deviations (SD) or medians with interquartile ranges (IQR), as appropriate. Differences between parity groups were assessed using one-way analysis of variance (ANOVA) for normally distributed variables, Kruskal–Wallis tests for skewed distributions, and chi-square tests for categorical variables.
Weighted multivariable logistic regression models were used to assess the association between parity and depression, with results presented as odds ratios (ORs) and 95% confidence intervals (CIs). Four models were constructed: Model 1: unadjusted; Model 2: adjusted for sociodemographic variables, including age, race/ethnicity, BMI, marital status, and educational level; Model 3: additionally adjusted for lifestyle factors, including smoking status, alcohol consumption, and physical activity; Model 4: the fully adjusted model, which further included history of hypertension, diabetes, and cardiovascular disease (CVD).To explore a potential nonlinear dose–response relationship between parity and depression, a restricted cubic spline (RCS) regression model was applied with covariates from the fully adjusted model. Parity was treated as a continuous variable, with knots placed at the 5th, 35th, 65th, and 95th percentiles [22]. Based on the smoothed curve generated by the RCS analysis, a piecewise linear logistic regression model was subsequently constructed to identify potential threshold effects of parity on depression, while adjusting for possible confounders.
In the subgroup analyses, multivariable logistic regression models were employed to evaluate potential effect modification. Interaction terms between the primary exposure variable (parity) and stratification factors—including age, race/ethnicity, marital status, educational level, BMI, smoking status, and alcohol consumption—were incorporated into the models. Likelihood ratio tests were used to assess the statistical significance of interaction effects. For each categorical subgroup, odds ratios (ORs) and 95% confidence intervals (CIs) were reported. To account for multiple comparisons, the Bonferroni correction was applied to both the primary and subgroup analyses.
This study employed mediation analysis to examine the potential mediating role of sleep duration in the association between parity and depressive symptoms. The analysis was based on the following statistical assumptions: (1) the relationships among variables in the model are not influenced by unmeasured confounding factors; (2) the statistical associations between variables are consistent with the assumed causal sequence; and (3) the model specification (linear relationships) is correct.A weighted linear regression model was used to assess the relationship between parity and sleep duration, while a weighted logistic regression model evaluated the association between sleep duration and depressive symptoms. The “mediation” package in R was utilized to estimate the mediating effect of sleep duration, with bootstrapping (1,000 iterations) employed to calculate confidence intervals. The model was adjusted for the following covariates: age, race, body mass index (BMI), marital status, educational level, smoking status, alcohol status, physical activity, hypertension, diabetes, CVD. The results reported the average causal mediation effect (ACME), average direct effect (ADE), total effect, and the proportion mediated.Additionally, given the cross-sectional design of this study, the mediation analysis is exploratory. Its purpose is to quantify the statistical indirect effects among the variables and to provide preliminary cross-sectional evidence for the theoretical hypothesis that parenting stress may influence depressive symptoms by affecting sleep duration, rather than to establish causal pathways.
To verify the robustness of the research findings, we conducted five sensitivity analyses: First, the association between parity and depressive symptoms was re-evaluated using a Patient Health Questionnaire-9 (PHQ-9) score of ≥ 5 as an alternative diagnostic criterion for depressive symptoms. Second, multiple regression analysis was performed after handling missing covariate data using single imputation to examine the impact of data completeness on the results. Third, alcohol intake measured in grams was included in the model as a substitute covariate for the three-category alcohol consumption variable (never/former/current). Fourth, menopausal status was additionally adjusted to control for its potential confounding effect. Finally, a directed acyclic graph (DAG) was constructed (see Supplementary Material 1, Figure S1), and the association between exposure and outcome was re-assessed based on the identified minimal sufficient adjustment set. All analyses were conducted using R version 4.2.2 (http://www.R-project.org, R Foundation) and Free Statistics version 2.1. A P-value of less than 0.05 was considered statistically significant.