
To address our research questions, we analyzed nationwide panel data tracking representative households in Korea. Specifically, we utilized data from the Korea Welfare Panel Study (KoWePS) from 2007 to 2021, which was initiated in 2005 by Seoul National University and the Korea Institute for Health and Social Affairs. KoWePS is an annual panel survey conducted through direct face-to-face interviews with a sample of 7702 households and 18,856 individuals. KoWePS serves as a valuable data source for longitudinal analyses of migrants’ mental health and its determinants, as it collects a comprehensive array of individual- and household-level information encompassing household income, housing-related circumstances, and mental health conditions.
Based on the KoWePS data, we constructed the analytical sample using the following selection criteria. First, we excluded observations from Wave 1 (2005) and Wave 2 (2006), as these waves did not provide sufficient information to calculate housing costs.Footnote 1 Second, following prior research (Nowok et al., 2013), we excluded individuals who failed to respond to questions that are required to construct key variables that may influence mental health, including age, health status, marital status, and number of children within a household. Third, to examine the effects of migration on mental health throughout the migration process, we included only individuals who experienced at least one migration between Wave 3 and Wave 17 and who responded to the KoWePS survey for at least two consecutive years either before or after the migration event. Notably, to secure a sufficient sample size, we included individuals who experienced more than one migration event during the observation period, rather than limiting our analytical sample to those who migrated only once. Applying these criteria, the final analytical sample comprised 78,639 observations from 6895 individuals.
As one of the most developed countries in East Asia, Korea has been known to present interesting migration types that exhibit the characteristics of both developing and developed countries (Lee and Kim, 2020). Korea’s urban hierarchy can be characterized as having pronounced regional disparities in housing and economic conditions. Especially, a large proportion of the population and job opportunities are concentrated in Seoul—the Capital city of Korea—further widening the regional disparities between Seoul, its surrounding regions, and others (Korea Research Institute for Human Settlements, 2021; Organization for Economic Co-operation and Development [OECD], 2021, 2018). For instance, according to Statistics Korea, as of 2023, the population of the Seoul metropolitan area (i.e., Seoul and its surrounding regions) stands at approximately 26.19 million, accounting for about 50.6% of the national population. Moreover, the Seoul metropolitan area encompasses around 50.0% of employed individuals in 2020, 52.0% of all businesses in 2023, and contributes 52.8% of the national Gross Regional Domestic Product (GRDP) in 2022. Despite the relatively long history of urbanization and public efforts to reduce regional disparities (Seo, 2007), traditional metropolitan areas like Busan, Daegu, Gwangju, Daejeon, and Ulsan have gradually been surpassed in prominence by Incheon and Gyeonggi, which surround Seoul. These regions, closely integrated with Seoul through advances in transportation networks (e.g., bus, subway, highway), currently function as extensions of Seoul’s metropolitan area, solidifying their status as the second level in the Korean urban hierarchy (Chun and Kim, 2022). While some traditional metropolitan areas still have larger populations than Incheon or individual cities in Gyeonggi, the economic and functional integration of Incheon and Gyeonggi with Seoul gives them a distinct hierarchical advantage (Chun and Kim, 2022). Moreover, in recent years, traditional metropolitan areas have experienced net population outflows to the Capital regions (Lee and Kim, 2020), which may reinforce the dominance of the Seoul metropolitan area. Within such a unique Korean urban hierarchy, a group of individuals, especially young individuals who are in their early life stages, tend to migrate to more urbanized regions within the hierarchy to access various education and job opportunities, while another group of individuals tend to migrate down to less urbanized regions due in part to high housing and living costs in more urbanized regions (Lee and Kim, 2020). Given this unique hierarchical structure between regions and the associated migration types within the structure, Korea can serve as a valuable case for examining long-term changes in migrants’ mental health related to migration. To our knowledge, despite the unique characteristics of Korea, few studies have examined mental health and migration from a longitudinal perspective (Park et al., 2024), which primarily focused on the role of changes in housing tenure without considering the degree and significance of changes associated with migration within the Korean urban hierarchy.
We categorized various regions in Korea into five hierarchies (see Fig. 2): (1) Seoul, (2) urban areas surrounding Seoul, (3) metropolitan cities in non-Capital regions, (4) non-metropolitan cities in non-Capital regions, and (5) rural areas. This classification primarily follows Korea’s existing administrative divisions, operationally defined by population size; for example, “Si” regions have 150,000 or more and are classified as urban areas, and “Gun” regions with fewer than 150,000 residents are classified as rural areas. Although population size serves as the official criterion for distinguishing these administrative units and the existing literature on urban hierarchy has heavily relied on population size for classifying different regions (Plane et al., 2005), such definitions inherently encapsulate broader socioeconomic dimensions beyond mere demographic scale. Specifically, based on the literature on regional disparities, we argue that this classification reflects disparities in income, employment opportunities, educational access, and public perceptions regarding regional inequalities (see the detailed review in Supplementary Note 1 in Supplementary Materials).
Fig. 2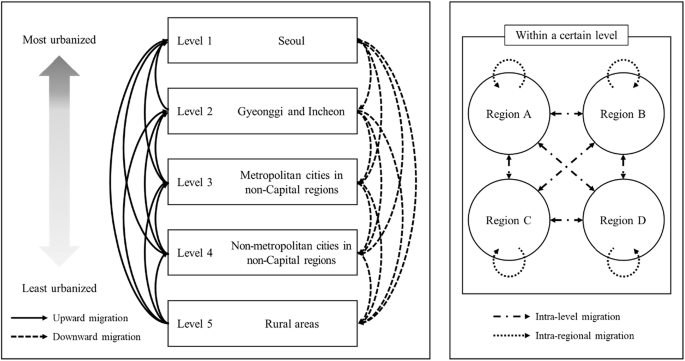
The urban-rural continuum of South Korea and types of migration.
In Korea, regions are typically divided into three categories according to economic and socio-demographic factors (OECD, 2018): (1) Seoul metropolitan areas, which includes Seoul, the Capital city, and its surrounding areas (i.e., Gyeonggi and Incheon), (2) six metropolitan areas (i.e., Busan, Daegu, Gwangju, Daejeon, Ulsan), and (3) provinces (i.e., Gangwon, Chungbuk, Chungnam, Jeonbuk, Jeonnam, Gyeongbuk, Gyeongnam, Jeju). However, H. M. Kim and Han (2012) have underscored that Seoul—which is a Capital city, not part of the metropolitan area—has unique economic conditions and institutional environments compared to other regions. Thus, we further subdivided the Seoul metropolitan area into two regions: (1) Seoul and (2) the urban areas (i.e., “Si” regions) surrounding Seoul. To establish a more rigorous urban hierarchy as a continuum, we further divided provinces into non-metropolitan cities in non-Capital regions (i.e., “Si” regions) and rural areas (i.e., “Gun” regions).
In this study, migration refers to the relocation of a household for long-term residence (Bell and Ward, 2000). Accordingly, the experience of migration was measured as follows. Each year, KoWePS asks participants the question, “Did your household move in the past year?” Respondents who answered “Yes” were classified as having experienced migration, while those who answered “No” were considered non-migrants. This measurement can minimize the inclusion of temporary mobility (e.g., business trips or family vacations) because the survey question used the term, isa in Korean, which typically refers to a long-term relocation where an individual or a household changes primary residence. Based on Bell and Ward’s (2000) typology of permanent and temporary mobility, the following questions in questionnaires regarding housing conditions (e.g., types or sizes of housing) also imply that migration measured in the KoWePS is intended to capture permanent relocation for long-term residence, not temporary mobility.Footnote 2
Based on this measurement, we classified all migrations within the hierarchy into four groups. First, upward migration (i.e., migration to more urbanized regions) refers to the moving of individuals from lower to higher level within the hierarchy, such as migration from rural areas to non-metropolitan cities in non-Capital regions. Second, downward migration (i.e., migration to less urbanized regions) denotes migration from higher to lower levels, such as from Seoul to metropolitan cities in non-Capital regions. Third, intra-level migration describes migrants who move without changing their hierarchical position, indicating migration within the same level. Last, intra-regional migration refers to migrants who have moved but have not crossed the regional boundaries.
Building on previous research indicating that the effects of migration on mental health vary across the different phases of migration, we divided the migration process into three phases: pre-migration, migration event, and post-migration. Based on this, we examine whether differences in the urban hierarchy between origin and destination regions have heterogeneous effects on migrants’ mental health during each phase of migration. We constructed dummy variables as independent variables for the time to the migration process (−5, −4, −3, −2, −1, 0, 1, 2, 3, 4, 5), indicating the number of years before and after the migration event, to examine changes in mental health during the migration process. This 11-year window enables more precise estimation by minimizing the potential errors caused by regarding migration-affected years as unaffected reference periods, which may otherwise introduce bias. Prior studies that investigate the longitudinal effects of migration have employed varying time frames, ranging from 2 to 10 years around the migration event (Frijters et al., 2011; Melzer, 2011; Preston and Grimes, 2019). However, using a shorter window can result in reference years overlapping with periods in which migration-related effects still exist, which potentially leads to an underestimation of migration’s effects. To avoid this, we utilized the longest available window in our data—5 years before and 5 years after the migration event, following the approach of comparable studies (Nowok et al., 2013; Wolbring, 2017).
Subsequently, we created the dummy variables for the time of migration, which indicates the number of years before and after migration. While some individuals may have experienced migration only once, others may have migrated multiple times during the study period. In cases where pre-migration (i.e., anticipation) and post-migration (i.e., adaptation) effects may coexist within the same year, we assumed that pre-migration effects take precedence over post-migration effects. This assumption is grounded in the residential dissatisfaction theory, which posits that individuals decide to migrate when accumulated dissatisfaction during the pre-migration period surpasses a critical threshold. Thus, experiencing multiple migration events may indicate that pre-migration effects, reflecting accumulated dissatisfaction, dominate post-migration effects. Following this theoretical framework and prior research (Nowok et al., 2013), we regarded overlapping periods as reflecting primarily pre-migration effects. Through this approach, we aimed to compare mental health at various points during the migration process with that of the non-migration process.
We chose to measure the mental health of migrants by assessing the extent of depressive symptoms, which can serve as a potential precursor to deteriorating mental health. To measure depressive symptoms, we employed the Center for Epidemiologic Studies Depression (CES-D 11) scores, which are widely utilized in numerous mental health studies (S. Kim et al., 2021; G.-R. Park and Seo, 2023). While we acknowledge that the CES-D 11 may be subject to self-report bias—such as the tendency to underreport symptoms due to social desirability or recall errors—and cannot capture other aspects of affective well-being, such as anxiety, it has been validated in health-related research as a reliable tool for assessing depressive symptoms in the general population (Cho and Kim, 1998). The CES-D 11 is a shortened version of the traditional CES-D, originally consisting of 20 items. Respondents answer each of the 11 itemsFootnote 3 on a scale from zero (rarely or none of the time, less than a day) to three (mostly, 5–7 days or more a week). Subsequently, summing the values for each item results in a total score ranging from 0−33, with a higher score indicating a greater degree of depression.
Changes in housing-related conditions during the migration process can influence migrants’ mental health. In Korea, the highly financialized housing market (Yi, 2022) and significant socio-economic inequalities between regions (OECD, 2021) may exacerbate the effect of migration-related housing changes on mental health. For example, Park et al. (2024) found that Korean migrants who transitioned from renting to homeownership demonstrated significantly higher life satisfaction both pre- and post-migration. Conversely, those transitioning from homeownership to renting demonstrated a decline in life satisfaction before the migration. Therefore, this study includes housing tenure (homeowner and non-homeowner), housing costs-to-income ratioFootnote 4 (measured by the ratio of monthly housing costs (i.e., home mortgage loan and interest payment, housing management expenses, utilities expenses, home furnishing expenses, rent, deposit opportunity costs) for monthly household income), and overcrowding (measured by whether migrants meet the minimum living space requirement per household member as defined by the Korean government) as key housing-related variables in the analytical model.Footnote 5
Building on existing research examining the relationship between migration and mental health (Nowok et al., 2013), this study included the following control variables into the analytical model: age group (15–39, 40–49, 50–59, 60–69, and age over 70), health status (presence of chronic disease), marital status (single, married, widowed/divorced/separated), log-transformed average monthly household income, and employment status (regular worker, temporary worker, stable self-employed, unstable self-employed, unemployed, and economically inactive). We also included a set of year dummy variables to control for any year-specific effects.
Furthermore, following existing studies that suggest men and women may have distinct experiences during the migration process (Kettlewell, 2010; Nowok et al., 2013), this study conducted additional analyses by examining men and women separately. Through all these analyses, this study contributes to the literature by demonstrating that the longitudinal relationship between migration and mental health may vary depending on the combination of migration type within the urban hierarchy and gender.
To exploit the advantages of analyzing panel data, we employed a fixed-effects regression model to examine the effects of migration on mental health. Unlike cross-sectional data, panel data collects various types of information, such as individuals’ mental health and socio-economic status, at multiple time points. This characteristic provides a significant advantage in examining the causal relationship between migration and mental health (Helske and Tikka, 2024). Furthermore, it enables the investigation of the dynamic effects of mental health throughout the migration process (Hsiao, 2007). In particular, the fixed-effects model utilizes within-individual variations over time while controlling for individual-specific characteristics, such as gender or ethnicity, as well as unobserved time-invariant factors, including personality traits or early-life experiences. By accounting for this time-invariant heterogeneity, the fixed-effects model enables a more accurate estimation of the effects of migration on mental health. We estimate the following equation to represent the relationship between migration and mental health.
$$\begin{array}{lll}{{DS}}_{{it}} = {\alpha }_{i}+{\beta }_{1}{\left({-5}_{{th}}{years}\right)}_{{it}}+{\beta }_{2}{\left({-4}_{{th}}{years}\right)}_{{it}}+{\beta }_{3}{\left({-3}_{{rd}}{years}\right)}_{{it}}+{\beta }_{4}{\left({-2}_{{nd}}{years}\right)}_{{it}}\\\qquad\quad\; +\, {\beta }_{5}{\left({-1}_{{st}}{year}\right)}_{{it}}+{\beta }_{6}{\left({Migration\; event}\right)}_{{it}}+{\beta }_{7}{\left({+1}_{{st}}{year}\right)}_{{it}}+{\beta }_{8}{\left({+2}_{{nd}}{years}\right)}_{{it}}\\\qquad\quad\; +\, {\beta }_{9}{({+3}_{{rd}}{years})}_{{it}}+{\beta }_{10}{({+4}_{{th}}{years})}_{{it}}+{\beta }_{11}{({+5}_{{th}}{years})}_{{it}}+\theta {X}_{{it}}+{\delta }_{t}+{\epsilon }_{{it}}+u\end{array}$$
where DSit denotes the depressive symptoms of individual i in period t. The individual fixed effect, \({\alpha }_{i}\), account for any unobserved, time-constant heterogeneity. The variables associated with \(\beta\) coefficients represent the timing of migration, capturing the pre-migration, migration event, and post-migration phases. Xit is a vector of time-varying covariates, including socio-demographic, housing-related, and economic characteristics. \({\delta }_{t}\) denotes year-fixed effects, affecting all migrants equally. \({\epsilon }_{{it}}\) is a stochastic error term, with i indexing the individual and t representing time. u is the intercept term.
The fixed-effects models effectively address endogeneity issues, such as reverse causality, by controlling for time-invariant characteristics and unobserved heterogeneity at the individual level (Park et al., 2024); however, they are not entirely free from such concerns. Nevertheless, the KoWePS data used in this study is relatively less susceptible to reverse causality issues. This is because there is a temporary discrepancy between the timing of the mental health assessment and the measurement of independent and control variables. KoWePS conducts surveys annually from February to June over 4 months. While the CES-D 11 scores assess mental health based on the survey period, individual and household characteristics are measured as of December 31 of the previous year. For example, in the 2018 survey, respondents answered the CES-D 11 based on their mental health status in 2018, whereas their individual and household characteristics were reported as of December 31, 2017. This survey structure helps mitigate the possibility of reverse causality, where mental health influences migration decisions rather than the other way around.