
If you are wondering whether LifeStance Health Group is attractively priced or still carrying a premium, you are not alone. This article is built to unpack what the current share price might be implying. The stock last closed at US$6.92, with a recent 7 day return of 5.8%, a 30 day return of 4.6% decline, and year to date and 1 year returns of 0.6% decline and 13.4% decline respectively, set against a 3 year return of 23.1%. Recent news coverage around LifeStance Health Group has focused on its role in outpatient mental health services and investor interest in how that business model fits within the broader healthcare sector. This has helped frame current discussions around how much risk investors are taking on at the current share price. Our valuation model currently gives LifeStance Health Group a valuation score of 2 out of 6. We will break this down using several common methods, and then finish with a framework that can help you judge whether those valuation signals truly fit your own view of the business.
LifeStance Health Group scores just 2/6 on our valuation checks. See what other red flags we found in the full valuation breakdown.
Approach 1: LifeStance Health Group Discounted Cash Flow (DCF) Analysis
A Discounted Cash Flow, or DCF, model estimates what a company might be worth today by projecting its future cash flows and then discounting those back into present value terms. It is essentially asking what all future cash flows are worth in today’s dollars.
For LifeStance Health Group, the model used is a 2 Stage Free Cash Flow to Equity approach. The latest twelve month free cash flow is about $113.6 million, and analysts have provided specific forecasts through to 2027, with Simply Wall St extending those projections out to 2035. For example, free cash flow for 2026 is modeled at $116.8 million and for 2027 at $80.2 million, with further years extrapolated from these inputs.
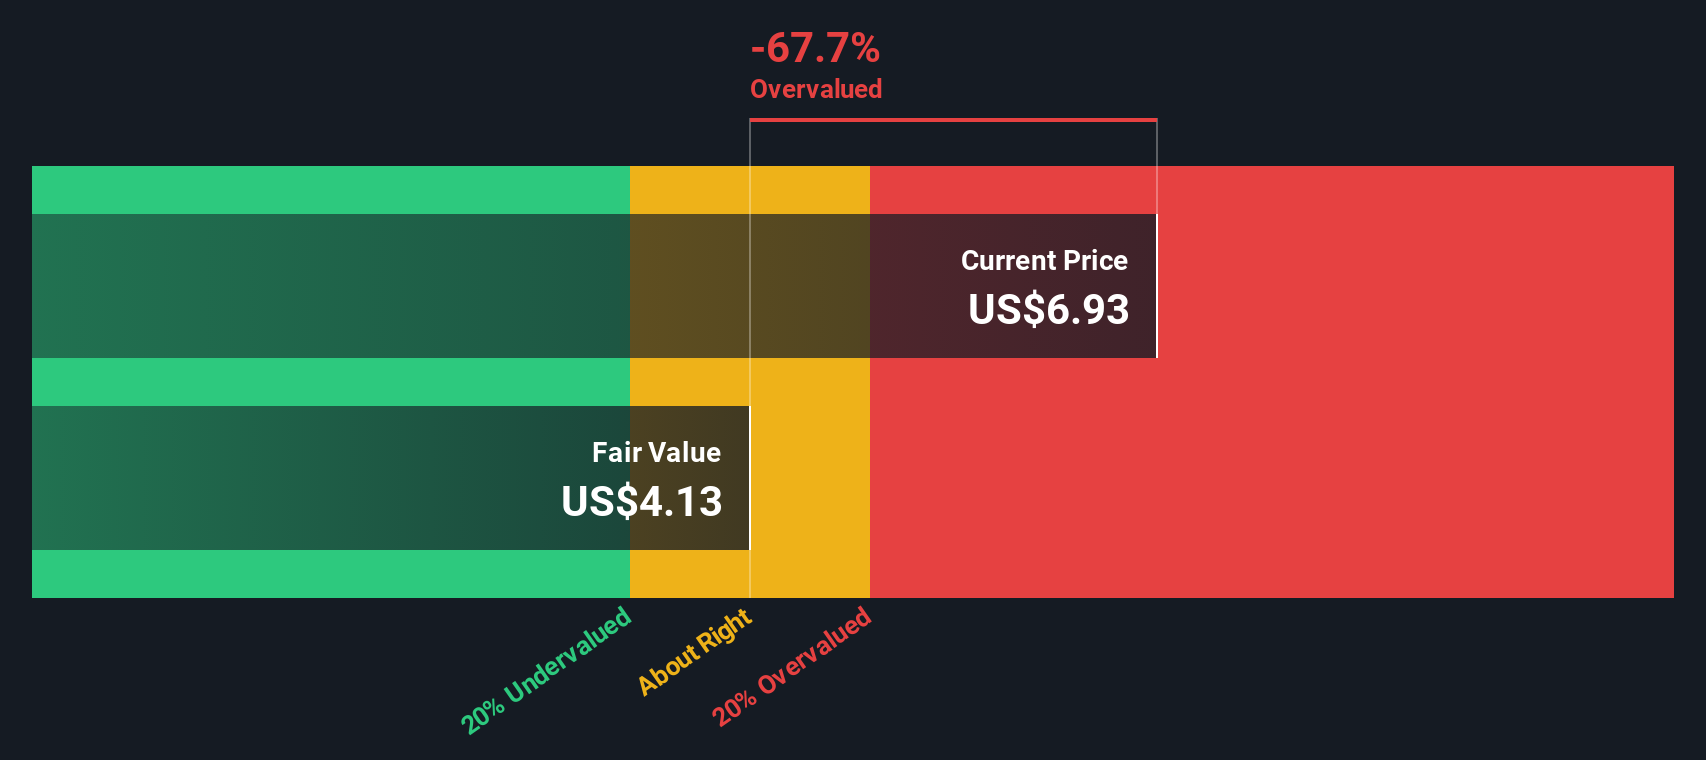
When all those projected cash flows are discounted back, the DCF model arrives at an estimated intrinsic value of about $4.13 per share. Set against the recent share price of $6.92, this indicates the stock is around 67.5% above this cash flow-based estimate of value.
Result: OVERVALUED
Our Discounted Cash Flow (DCF) analysis suggests LifeStance Health Group may be overvalued by 67.5%. Discover 55 high quality undervalued stocks or create your own screener to find better value opportunities.
 LFST Discounted Cash Flow as at Feb 2026
Approach 2: LifeStance Health Group Price vs Sales
For companies where earnings are not a clear guide, the P/S ratio is often a useful way to think about value, because it compares what you are paying to the revenue the business is already generating. It is simple, but it still reflects how the market is weighing growth prospects and risk.
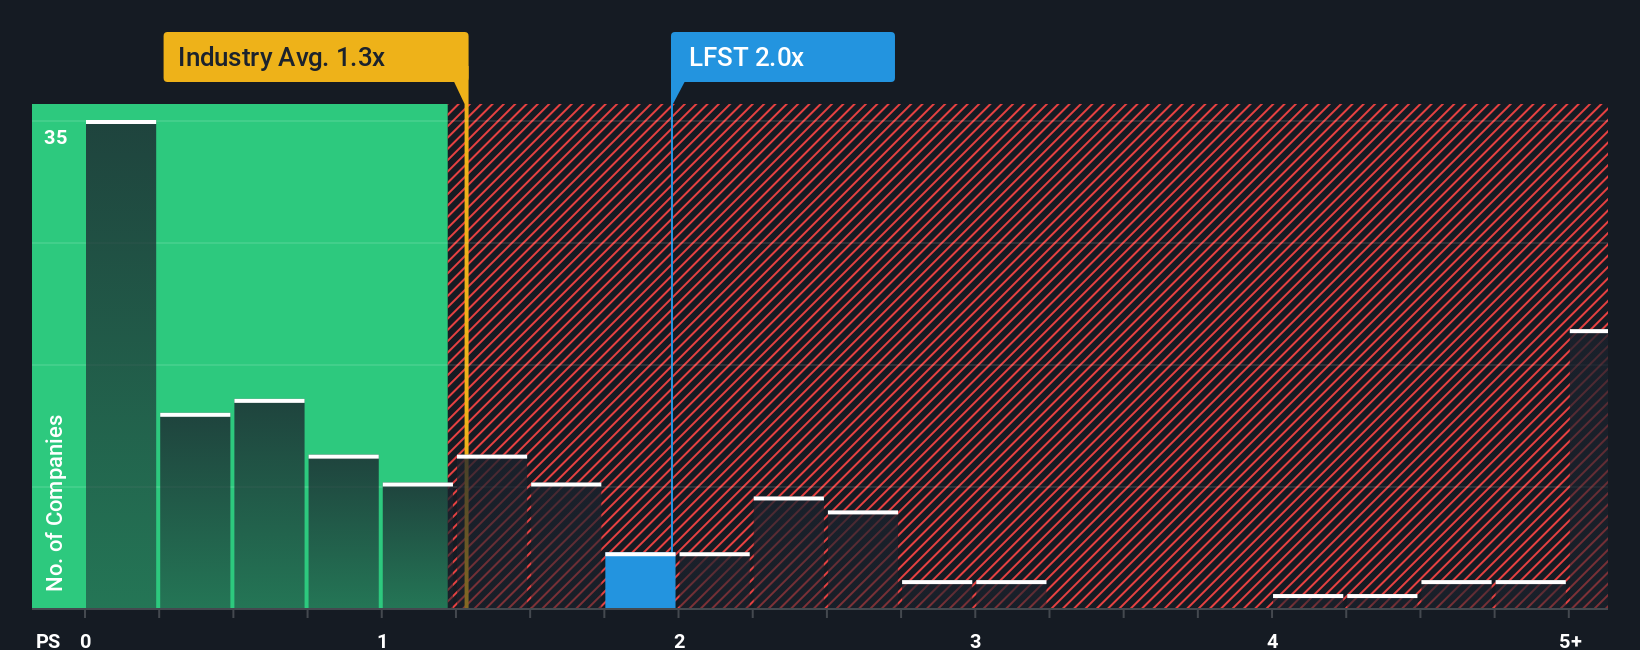
Higher growth expectations or lower perceived risk usually line up with a higher “normal” P/S multiple, while slower growth or higher risk tends to justify a lower one. LifeStance Health Group currently trades on a P/S of 1.97x. That sits above the Healthcare industry average of about 1.28x and below the peer group average of 2.97x, so the market is pricing it between those two reference points.
Simply Wall St’s Fair Ratio takes this a step further. It is a proprietary estimate of what P/S might be reasonable for LifeStance Health Group, after considering factors like earnings growth, profit margins, industry, market cap and company specific risks. For LifeStance Health Group, this Fair Ratio is 1.30x, which is meaningfully below the current 1.97x. On this basis, the stock is screening as expensive relative to what that tailored benchmark suggests.
Result: OVERVALUED
 NasdaqGS:LFST P/S Ratio as at Feb 2026
P/S ratios tell one story, but what if the real opportunity lies elsewhere? Start investing in legacies, not executives. Discover our 23 top founder-led companies.
Upgrade Your Decision Making: Choose your LifeStance Health Group Narrative
Earlier we mentioned that there is an even better way to understand valuation, so let us introduce you to Narratives.
A Narrative is simply your story about a company, tied directly to the numbers you think are reasonable, like fair value, future revenue, earnings and margins.
On Simply Wall St, Narratives live in the Community page and turn that story into a clear forecast, then into a Fair Value that you can compare with the current share price to decide whether the stock looks cheap or expensive to you.
They also update automatically when new information such as news or earnings is added, so your view does not go stale without you noticing.
For LifeStance Health Group, one investor might build a cautious Narrative that lines up more with a Fair Value around US$6.50. Another might build an optimistic Narrative that lines up with a Fair Value closer to US$10.00. Simply Wall St helps you see both side by side so you can decide which story and valuation feels more realistic to you.
Do you think there’s more to the story for LifeStance Health Group? Head over to our Community to see what others are saying!
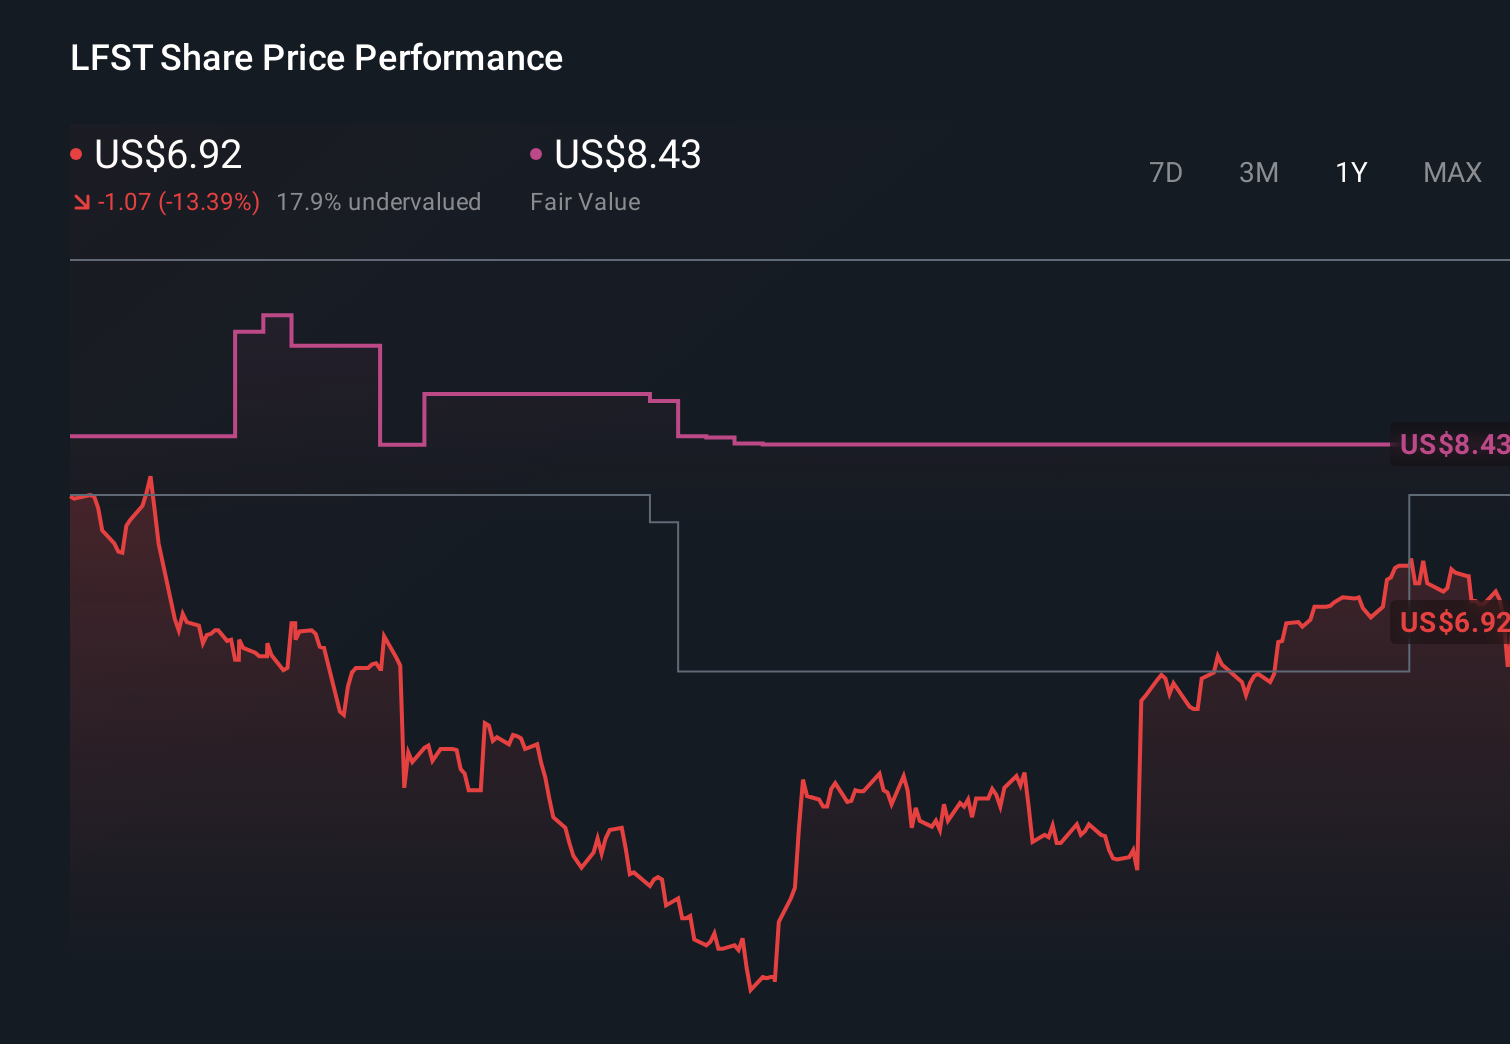 NasdaqGS:LFST 1-Year Stock Price Chart
This article by Simply Wall St is general in nature. We provide commentary based on historical data
and analyst forecasts only using an unbiased methodology and our articles are not intended to be financial advice. It does not constitute a recommendation to buy or sell any stock, and does not take account of your objectives, or your
financial situation. We aim to bring you long-term focused analysis driven by fundamental data.
Note that our analysis may not factor in the latest price-sensitive company announcements or qualitative material.
Simply Wall St has no position in any stocks mentioned.
New: AI Stock Screener & Alerts
Our new AI Stock Screener scans the market every day to uncover opportunities.
• Dividend Powerhouses (3%+ Yield)
• Undervalued Small Caps with Insider Buying
• High growth Tech and AI Companies
Or build your own from over 50 metrics.
Have feedback on this article? Concerned about the content? Get in touch with us directly. Alternatively, email editorial-team@simplywallst.com