
Summary of research approach
Our analytic approach consisted of five key steps to identify and characterize the specific neural factors underlying externalizing and internalizing symptoms. First, we used connectome-based predictive modeling24 to estimate brain signatures of individual psychiatric symptoms using multiple task-based functional magnetic resonance imaging conditions from the IMAGEN cohort (age 14, N = 1,750). Specifically, we parcellated task-based imaging data from the stop-signal task (SST), monetary incentive delay task (MID) and emotional face task (EFT) into 268 nodes based on a well-established whole-brain functional atlas25. We then estimated condition-specific functional connectivity (FC) for each node pair and used these connectivity matrices to predict eight psychiatric symptoms. Second, to identify stratified neural factors (the focus of the current study), we identified functional connections that predicted multiple symptoms within the same domain (externalizing symptoms or internalizing symptoms) but not symptoms from the other domain. We then conducted permutation-based reliability analyses and longitudinal persistence analyses to determine which task conditions and edge types reliably predicted specifically externalizing or internalizing symptoms. Third, we characterized the stratified neural factors at multiple levels, examining their neuroanatomical configurations, behavioral correlates and genetic substrates. Fourth, we assessed the generalizability of these stratified factors across different developmental periods, imaging modalities and clinical populations using multiple independent datasets (ABCD, STRATIFY/ESTRA, ABIDE II, ADHD-200 and XiNan). Lastly, we characterized and compared the neurobiological specificity of the general and stratified neural factors at the multilevel from region to large-scale network.
Stratified neural factors of externalizing and internalizing symptoms
Our previous study found significant predictive effects of task-based connectomes on 8 psychiatric symptoms in 14-year-old participants from the IMAGEN study7 (Fig. 1a and Supplementary Tables 1 and 2; N = 1,750). For each psychiatric symptom, we generated a brain-predicted measure. Interestingly, we observed that there were significantly higher similarities between brain-predicted symptoms than the observed psychiatric symptoms (externalizing symptoms, brain-predicted rmean = 0.91, observed rmean = 0.37, Pperm < 0.001 for the difference; internalizing symptoms, brain-predicted rmean = 0.52, observed rmean = 0.28, Pperm < 0.001 for the difference) (Fig. 1b,c). The results thus suggested substantial shared neural bases within externalizing and internalizing symptoms.
Fig. 1: Identification of the stratified neural factors.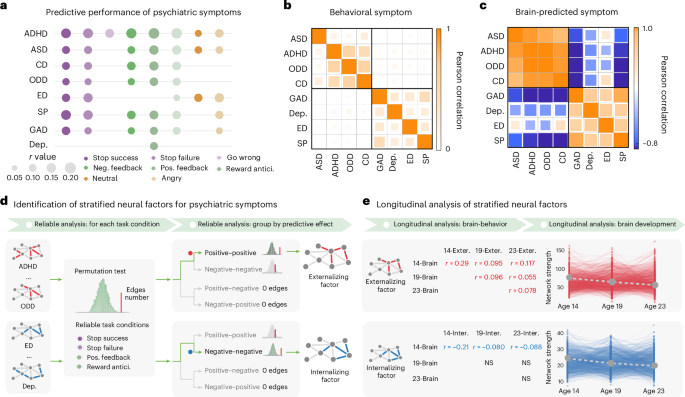
a, The predictive performance of behavioral symptoms related to psychiatric symptoms with the task-based connectivity model. Task-based connectivity was estimated from the EFT (angry and neutral conditions), the MID task (reward anticipation, positive reward feedback and negative reward feedback conditions) and the SST (go-wrong, stop-success and stop-failure conditions). b, The correlation matrix of the behavioral symptoms. The externalizing and internalizing symptoms showed high intra-correlations within their respective psychiatric domain, but low correlations between each other. Externalizing symptoms consisted of ASD, ADHD, CD and ODD. Internalizing symptoms comprised GAD, Dep., ED and SP. c, The correlation matrix of the brain-predicted symptoms. d, With a two-step reliable analysis, we identified two stratified neural factors for externalizing and internalizing symptoms, respectively. We first identified task conditions with reliable stratified cross-disorder edges, which are defined as predictive edges that only predict externalizing but not internalizing symptoms and vice versa. We found that only conditions from the SST and MID task had significantly more stratified cross-disorder edges than a random observation. Then, we further identified which type of cross-disorder edges reliably predict externalizing or internalizing symptoms, which were termed the stratified factors. We discovered that the externalizing neural factor consisted of positive–positive cross-disorder edges (positively predicted at least two externalizing symptoms), while the internalizing neural factor comprised negative–negative cross-disorder edges (negatively predicted at least two internalizing symptoms). e, We checked the longitudinal predictive effects and developmental trajectories of the stratified factors across ages 14, 19 and 23. Abbreviations: CD, conduct disorder; ODD, oppositional defiant disorder; GAD, general anxiety disorder; Dep., depression; ED, eating disorder; SP, specific phobia; Neg. feedback, negative feedback; Pos. feedback, positive feedback; Reward antici., reward anticipation; NS, not significant; 14-brain, brain at age 14; 19-brain, brain at age 19; 23-brain, brain at age 23; 14-exter., externalizing symptoms at age 14; 19-exter., externalizing symptoms at age 19; 23-exter., externalizing symptoms at age 23; 14-inter., internalizing symptoms at age 14; 19-inter., internalizing symptoms at age 19; 23-inter., internalizing symptoms at age 23.
We next aimed to identify specific neural factors, termed as ‘stratified neural factors’, comprising cross-disorder edges that predicted two or more symptoms from a single psychiatric domain (externalizing or internalizing), while not predicting any symptoms from the other domain (Fig. 1d). We found that stratified cross-disorder edges were consistently and reliably identified from task conditions relating to inhibitory control and reward sensitivity (that is, stop success, stop failure, positive reward feedback and reward anticipation; all Pperm < 0.01; Supplementary Table 3). We further ascertained the neural mechanisms of the stratified cross-disorder edges in terms of their predictive effects (Fig. 1d). Intriguingly, we observed a double dissociation effect: externalizing symptoms were reliably associated with positive–positive cross-disorder edges (nedge = 1,268, Pperm < 0.001, showing positive correlations with externalizing symptoms), whereas internalizing symptoms were reliably associated with negative–negative cross-disorder edges (nedge = 469, Pperm < 0.001, showing negative correlations with internalizing symptoms) (Supplementary Table 4). Therefore, in the following analyses, the summed FC strength of positive–positive cross-disorder edges will be referred to as the externalizing neural factor, and the summed strength of negative–negative cross-disorder edges as the internalizing neural factor.
Longitudinal analysis of stratified neural factors
As previous research has highlighted the stability of internalizing and externalizing behaviors over time6, we next examined the longitudinal predictive performance of the two stratified neural factors from adolescence to early adulthood over a 10-year span (Fig. 1e). The externalizing factor demonstrated consistent performance for longitudinal prediction across ages 14, 19 and 23. To elaborate, the externalizing neural factor estimated at age 14 could significantly predict externalizing symptoms at ages 19 (N = 1,045, r = 0.095, 90% confidence interval (CI) = [0.03, ∞), t = 3.09, Pone-tailed = 0.001, Supplementary Table 5a; we used one-tailed tests based on the prediction of psychiatric symptoms from model-based neural factors, reporting 90% CIs for one-tailed tests and 95% CIs for two-tailed effect sizes) and 23 (N = 1,043, r = 0.117, 90% CI = [0.06, ∞), t = 3.79, Pone-tailed < 0.001, Supplementary Table 5a). Also, the externalizing neural factors estimated at ages 19 and 23 could predict their corresponding externalizing symptoms at the same age or later age (brain and symptoms both at age 19, N = 1,095, r = 0.096, 90% CI = [0.04, ∞), t = 3.20, Pone-tailed < 0.001; brain at age 19 and symptoms at age 23, N = 1,029, r = 0.055, 90% CI = [0.01, ∞), t = 1.77, Pone-tailed = 0.038; brain and symptoms both at age 23, N = 937, r = 0.078, 90% CI = [0.01, ∞), t = 2.388, Pone-tailed = 0.009, Supplementary Table 5c,e). By contrast, only the internalizing neural factor estimated at age 14 could significantly predict future internalizing symptoms measured at ages 19 and 23 (age 19, N = 1,045, r = −0.080, 90% CI = (−∞, −0.02], t = −2.59, Pone-tailed = 0.005; age 23, N = 1,043, r = −0.088, 90% CI = (−∞, −0.03], t = −2.84, Pone-tailed = 0.002, Supplementary Table 5b), but not for the internalizing neural factors estimated at ages 19 and 23 (Supplementary Table 5d,f).
We next examined the longitudinal changes of the two stratified neural factors across ages 14, 19 and 23 (Fig. 1e). While both the externalizing and internalizing neural factors maintained consistently high FC strengths throughout ages 14, 19 and 23 (all t > 100, Cohen’s d > 3.1, P < 0.001; note: the FC strength refers to the sum of FC in the identified networks), steady decreases in FC strength from age 14 to age 23 were also observed for both neural factors (externalizing slope βmean = −9.44, 95% CI = [−10.49, −8.39], t = −17.64, Cohen’s d = −0.68, P = 1.95 × 10−57; internalizing slope βmean = −2.33, 95% CI = [−2.57, −2.09], t = −18.89, Cohen’s d = −0.73, P = 4.83 × 10−64). During this critical developmental period, the normative decrease in connectivity strength could be explained by the neural pruning for a more efficient brain information process26. Lastly, we investigated the correlations between psychiatric symptoms at age 14 and the rate of decline in the stratified neural factors from age 14 to 23. We observed that individuals with higher baseline externalizing symptoms may have undergone an under-pruning process of the externalizing neural factor from adolescence to early adulthood (N = 575, r = −0.20, 95% CI = [−0.28, −0.12], t = −4.92, P = 1.12 × 10⁻⁶); conversely, individuals with higher baseline internalizing symptoms experienced an over-pruning process of the internalizing neural factor from adolescence to early adulthood (N = 575, r = 0.12, 95% CI = [0.04, 0.20], t = 2.96, P = 0.003). These results indicated that while both the externalizing and internalizing behavioral domains showed strong within-domain intra-correlations for both observed and neural predicted symptoms, each behavioral domain may be represented by a distinct cross-disorder neural substrate.
Neuroanatomical characterization of stratified neural factors
We characterized the above two stratified neural factors at multiple neuroanatomical levels. In terms of the regional network degree, the externalizing neural factor was mainly located in brain regions such as the middle cingulate cortex (MCC), precentral gyrus (PreCG), precuneus (PreCun), supramarginal gyrus (SMG) and putamen (Fig. 2a and Supplementary Table 6a), which were commonly implicated in the habitual control process27. By contrast, the internalizing neural factor was primarily enriched in regions such as the PreCun, ventromedial prefrontal cortex (vmPFC), medial orbitofrontal cortex (mOFC) and caudate (Fig. 2b and Supplementary Table 6b), all known to play crucial roles in goal-directed processing28.
Fig. 2: Multilevel neuroanatomical characterization of the two stratified neural factors.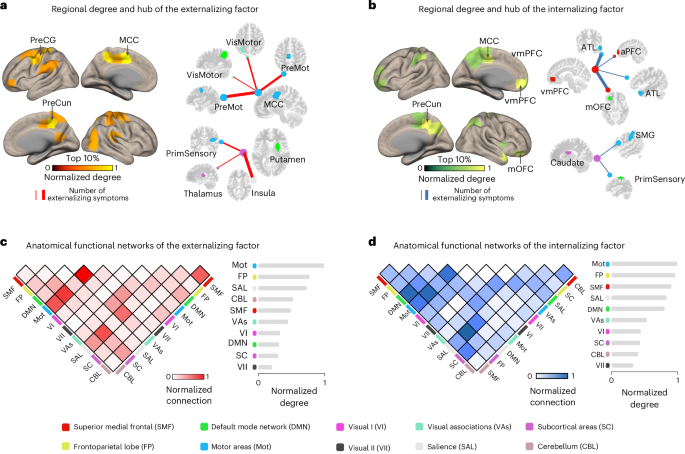
a,b, The top 10% nodes and hub node connections (with high regional connections) in the externalizing (a) and internalizing (b) factors. The color bar indicates the normalized node degree (that is, the number of connections with other nodes). c,d, The functional connections of the externalizing (c) and internalizing (d) factors shared similar large-scale network configurations that both were mainly localized between the motor, frontoparietal and salience networks. The color bar indicates the strength of normalized inter- or intra-network connections, where the number of connections between or within networks was divided by the largest connection number observed. Abbreviations: PreMot, premotor cortex; ATL, anterior temporal lobe; aPFC, anterior prefrontal cortex; VisMotor, visual motor; PrimSensory, primary sensory cortex.
Next, while the two stratified neural factors did not share overlapping edges, they did share similar network configurations at a higher neuroanatomical level. For instance, the externalizing and internalizing neural factors exhibited similar network-level configurations, primarily in the motor, frontoparietal and salience networks (Fig. 2c,d and Supplementary Table 7). Notably, the salience network plays a pivotal role in attending to motivational stimuli and recruiting appropriate functional brain-behavior networks to modulate behavior29. Therefore, the hyperconnectivity of the externalizing neural factor (for example, in high-risk individuals) might be associated with excessive perception of external stimuli and a lack of inhibitory control over automatic responses30,31. Conversely, the hypoconnectivity of the internalizing neural factor might be related to limited salience processing, resulting in difficulties in engaging goal-directed behaviors in individuals with internalizing disorders32.
Functional and genetic bases of stratified neural factors
We then investigated the correlations between task performance measures with the two stratified neural factors. Both the externalizing and internalizing neural factors showed significant negative correlations with accuracies in the MID task (externalizing, N = 1,620, r = −0.14, 95% CI = [−0.19, −0.09], t = −5.73, P < 0.001; internalizing, N = 1,620, r = −0.08, 95% CI = [−0.13, −0.03], t = −3.22, P = 0.001) and the go-trials in the SST (externalizing, N = 1,567, r = −0.26, 95% CI = [−0.31, −0.21], t = -10.62, P < 0.001; internalizing, N = 1,567, r = −0.20, 95% CI = [−0.25, −0.15], t = −8.01, P < 0.001), but no significant correlations with the reaction time in the MID task (externalizing, N = 1,620, r = −0.05, 95% CI = [−0.10, 0.001], t = −1.97, P = 0.05; internalizing, N = 1,620, r = −0.02, 95% CI = [−0.07, 0.03], t = −0.84, P = 0.40) nor stop-signal delay in the SST (externalizing, N = 1,567, r = −0.04, 95% CI = [−0.09, 0.01], t = −1.51, P = 0.13; internalizing, N = 1,567, r = −0.04, 95% CI = [−0.09, 0.01], t = −1.77, P = 0.08). These results were similar to the general neural factor (that is, the NP factor) findings in our previous study7.
Next, we examined the functional specificity of the two stratified neural factors across a wide range of cognitive-behavioral phenotypes. Here we applied the Benjamini–Hochberg procedure to control the false discovery rate (FDR). The externalizing neural factor exhibited specific correlations with impulsive and substance use behaviors (Fig. 3a and Supplementary Table 8a), where impulsivity is a characteristic feature of externalizing disorders and a known risk factor for future substance abuse33. By contrast, the internalizing neural factor was primarily correlated with maladaptive traits, such as neuroticism and negative thinking (Fig. 3a and Supplementary Table 8b), where neuroticism plays a pivotal role in longitudinally predicting various internalizing disorders, such as anxiety and depression34.
Fig. 3: Functional specificity and generalization of the stratified neural factors.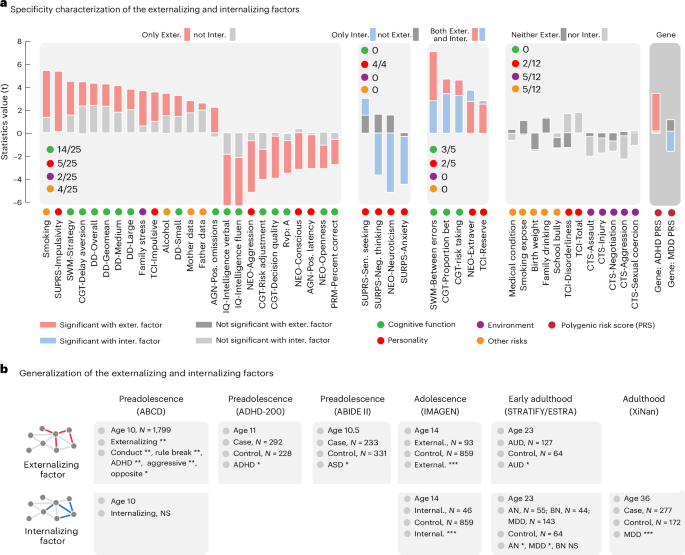
a, The externalizing factor was specifically associated with most cognitive functions (14 of 25). The internalizing factor was specifically correlated with personality traits (4/4), especially neuroticism and anxiety. Two executive function measurements (between errors in SWM and proportion bet in Cambridge Gambling Task (CGT)) and two personality traits (extroversion of NEO and reserve of TCI) showed distinct correlations with externalizing and internalizing symptoms. The PRS of ADHD and MDD showed a specific correlation with externalizing and internalizing factors, respectively. b, Generalization of the NP factor across multiple developmental periods from preadolescence to adulthood in both population and clinical case–control datasets (ABCD, N = 1,799; ADHD-200, N = 520; ABIDE II, N = 564; IMAGEN, N = 998; STRATIFY and ESTRA, N = 433; and XiNan, N = 449). The significance level (that is, the gray color) was given as an FDR of 0.05. As these were confirmatory analyses with expected effect directions, one-tailed tests were applied (* < 0.05, ** < 0.01, *** < 0.001). Abbreviations: fluen, fluency; Sen., sensation; Extraver, extraversion; Exter., externalizing; Inter., internalizing; AGN, affective go-no go; BMI, body mass index; DD, delay discounting task, which measured ‘waiting’ impulsivity64; NEO, NEO Personality Inventory; RVP: A, target sensitivity from rapid visual information processing task; PRM, pattern recognition memory task; SURPS, Substance Use Risk Personality Scale; SWM, spatial working memory task; TCI, Temperament and Character Inventory—Revised; AN, anorexia nervosa; BN, bulimia nervosa; AUD, alcohol use disorder.
Lastly, we investigated whether the two stratified neural factors had different genetic substrates by examining their correlations with the polygenic risk scores (PRSs) of attention-deficit/hyperactivity disorder (ADHD) and major depressive disorder (MDD) as the representations of externalizing and internalizing disorders, respectively. We observed a significant correlation of the externalizing neural factor with an increased PRS of ADHD (N = 1,594, r = 0.082, 90% CI = [0.03, ∞), t = 3.27, Pone-tailed < 0.001), but not with the PRS of MDD (N = 1,594, r = 0.024, 90% CI = [−0.03, 0.08], t = 0.96, P = 0.33) (we used one-tailed tests when examining correlations between neural factors and their hypothesized disorders, and two-tailed tests for all other correlations where no directional hypotheses existed). Conversely, a lower internalizing neural factor was only correlated with the PRS of MDD (N = 1,594, r = −0.04, 90% CI = (-∞, −0.00], t = −1.74, Pone-tailed = 0.041), but not with that of ADHD (N = 1,594, r = 0.008, 90% CI = [−0.04, 0.06], t = 0.32, P = 0.74). The above results hence suggested that the externalizing and internalizing neural factors have distinct behavioral and genetic implications for their corresponding psychiatric comorbidity.
Generalization of stratified neural factors
We evaluated the generalization performance of the two stratified neural factors in multiple population and clinical datasets.
First, with the MID task and SST in the Adolescent Brain Cognitive Development cohort (ABCD) dataset35, we found that the externalizing neural factor was significantly correlated with a wide range of externalizing symptoms at age 10, including externalizing (N = 1,799, r = 0.059, 90% CI = [0.01, ∞), t = 2.51, Pone-tailed = 0.006), rule break (N = 1,799, r = 0.070, 90% CI = [0.02, ∞), t = 2.97, Pone-tailed = 0.002), conduct (N = 1,799, r = 0.063, 90% CI = [0.02, ∞), t = 2.69, Pone-tailed = 0.006), aggressive (N = 1,799, r = 0.057, 90% CI = [0.01, ∞), t = 2.41, Pone-tailed = 0.008), oppositional defiant (N = 1,799, r = 0.054, 90% CI = [0.01, ∞), t = 2.30, Pone-tailed = 0.011) and attention symptoms (N = 1,799, r = 0.050, 90% CI = [0.01, ∞), t = 2.10, Pone-tailed = 0.018) (one-tailed tests were used here as we were validating previously established directional relationships between stratified factors and behaviors). In addition, the externalizing neural factor estimated at age 10 could also predict the summary score of all externalizing symptoms at age 11 (N = 1,042, r = 0.052, 90% CI = [0.00, ∞), t = 1.67, Pone-tailed = 0.047), as well as the subscores (N = 1,042, attention, r = 0.078, 90% CI = [0.02, ∞), t = 2.49, Pone-tailed = 0.007; oppositional defiant, r = 0.062, 90% CI = [0.00, ∞), t = 2.03, Pone-tailed = 0.021; rule break, r = 0.062, 90% CI = [0.01, ∞), t = 2.00, Pone-tailed = 0.022). By contrast, the internalizing neural factor showed no significant correlation with the internalizing-related symptom at age 10 or 11.
We also compared high-severity individuals (marked as severe or high risk for at least one externalizing or internalizing disorder) with healthy controls for the two stratified neural factors in the IMAGEN and ABCD datasets (owing to the unbalanced design, we report effective sample size and Cohen’s d with 95% CIs; Methods). For the externalizing neural factor, we found that externalizing participants had significantly higher factor scores than control groups in both IMAGEN (externalizing participants N = 93, the effective sample size Neffective = 336, t = 7.10, Cohen’s d = 0.77, 90% CI = [0.73, 0.82], P < 0.001) and ABCD datasets (externalizing participants N = 206, the effective sample size Neffective = 728, t = 2.63, Cohen’s d = 0.20, 90% CI = [0.17, 0.22], P = 0.009). However, the comparison of the internalizing neural factor between diagnosed patients and healthy controls was only significant in IMAGEN (internalizing participants, N = 46, the effective sample size Neffective = 174, t = −3.42, Cohen’s d = −0.52, 90% CI = [−0.55, −0.48], P < 0.001), but not in ABCD dataset (internalizing participants N = 32, the effective sample size Neffective = 126, t = 1.85, Cohen’s d = 0.33, 90% CI = [0.30, 0.36], P = 0.067).
Next, we investigated whether the two stratified neural factors had clinical relevance in the case–control STRATIFY and ESTRA cohort (age = 23) with the SST36. We found that the externalizing and internalizing neural factors were differentially associated with psychiatric disorders. To elaborate, the externalizing neural factor of patients with alcohol use disorder (N = 127) was significantly higher than in the healthy controls (N = 64) (t = 1.82, Cohen’s d = 0.28, 90% CI = [0.03, ∞), Pone-tailed = 0.035), but no significant group differences were found for this neural factor between healthy controls (N = 64) and patients with internalizing disorders (anorexia nervosa, N = 55, t = −0.54, Cohen’s d = 0.10, 95% CI = [−0.26, 0.46], P = 0.059; bulimia nervosa, N = 44, t = 1.47, Cohen’s d = 0.29, 95% CI = [−0.11, 0.69], P = 0.15; major depression, N = 143, t = 1.44, Cohen’s d = 0.22, 95% CI = [−0.08, 0.52], P = 0.15). However, the internalizing neural factor was significantly lower in patients with internalizing disorders than in healthy controls (N = 64) (internalizing patients, N = 242, t = −2.31, Cohen’s d = 0.32, 90% CI = (−∞, −0.06], Pone-tailed = 0.011; anorexia nervosa, N = 55, t = −3.04, Cohen’s d = 0.56, 90% CI = (−∞, −0.06], Pone-tailed = 0.002; bulimia nervosa, N = 44, t = −0.83, Cohen’s d = 0.16, 90% CI = [−0.56, 0.24], Pone-tailed = 0.20; major depression, N = 143, t = −2.04, Cohen’s d = 0.31, 90% CI = (−∞, −0.02], Pone-tailed = 0.021), but no significant group difference was found for the alcohol use disorder (N = 127, t = −0.92, Cohen’s d = 0.14, 95% CI = [−0.44, 0.16], P = 0.36).
Finally, we found that the externalizing factor generated using resting-state functional magnetic resonance imaging (with the same set of FC as defined in the IMAGEN cohort) was significantly higher in patients with autism spectrum disorder (ASD) (N = 233) than in healthy controls (N = 331) (ABIDE II, mean age = 10.5, t = 1.90, Cohen’s d = 0.08, 90% CI = [−0.03, ∞), Pone-tailed = 0.029). A significant difference was also observed in the group comparison between patients with ADHD (N = 292) and healthy controls (N = 228) (ADHD-200, mean age = 11, t = 2.06, Cohen’s d = 0.18, 90% CI = [0.067, ∞), Pone-tailed = 0.020). Furthermore, the internalizing factor generated using resting-state functional magnetic resonance imaging (with the same set of FC as defined in the IMAGEN cohort) of depressive patients (N = 277) was significantly lower than the control group (N = 172) (XiNan dataset, mean age = 36.1, t = −3.11, Cohen’s d = −0.30, 90% CI = (−∞, −0.18], Pone-tailed < 0.001). These results further supported the distinct contribution of externalizing and internalizing neural factors to externalizing and internalizing comorbidity, respectively.
Neural specificities of the three cross-disorder networks
Our previous study identified a general neural factor (NP factor) across the externalizing and internalizing symptoms. Here we would like to closely examine the specific configurations of the three cross-disorder neural factors (one general and two stratified neural factors) based on the specificity score, that is, the contribution of a factor after controlling for the other two factors (Fig. 4a, with further details available in Methods).
Fig. 4: Characterizing the specificity of the cross-disorder neural factors at the levels of brain regions and extended networks.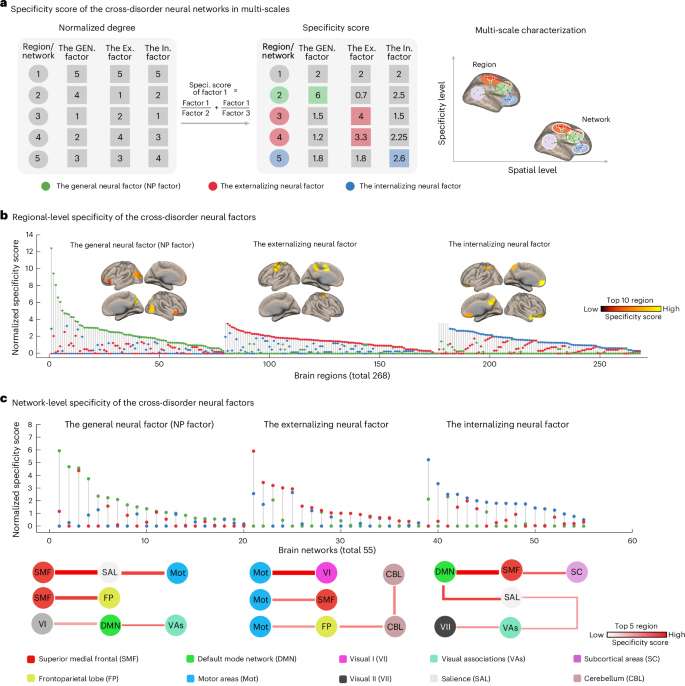
a, Specificity score comparison of the three cross-disorder networks using regional-level node degree as an example. We first normalized the node degree to facilitate subsequent cross-factor comparisons. Then, we used a weighted method for calculating the regional specificity score with the following formula: specificity score of factor 1 = factor 1/factor 2 + factor 1/factor 3. By weighting the contribution of the brain region in the other two cross-disorder factors (factor 2 and factor 3), the estimated specificity score provides a more robust measure of the unique contribution of each brain region within this cross-disorder factor (factor 1). Building upon previous findings16, we hypothesize that as the brain scale increases from region to network, the specificity between cross-disorder factors will decrease. b, Specificity scores were first computed for each of the 268 brain regions across the three cross-disorder factors (general/NP, externalizing, internalizing). For each region, the factor with the highest specificity score was considered to represent its dominant cross-disorder specificity. Regions are ranked by specificity score, and the top regions for each factor are visualized on the cortical surface. c, The same procedure was then applied at the network level (55 brain networks). Specificity scores were estimated for each network across the three cross-disorder factors. For each network, the highest specificity score was used to indicate its dominant factor-level specificity. Networks are ranked accordingly, and the top networks for each factor are highlighted. Abbreviations: GEN., general; Ex.,externalizing; In., internalizing; Speci., specificity.
We first estimated the specificity score of each brain region for the three cross-disorder neural factors, respectively (Fig. 4b, total 268 regions). We found that 79 regions exhibited predominant correlations (that is, with the highest specificity score) with the general NP factor, with the most prominent regions including the ventral precuneus, middle occipital cortex and inferior frontal cortex (Supplementary Table 9a). In addition, 97 regions were associated predominantly with the externalizing neural factor, most notably the primary sensorimotor cortex areas such as the precentral and middle cingulate cortex (Supplementary Table 9b). Finally, 92 regions showed predominant correlations with the internalizing neural factor, with notable regions including the medial prefrontal cortex and orbitofrontal cortex (Supplementary Table 9c). The specificity scores of the three cross-disorder neural factors were significantly different (F(2,265) = 15.80, partial η2 = 0.11, 95% CI = [0.05, 0.16], P < 0.001), with the general NP factor demonstrating significantly higher scores compared with either the externalizing or internalizing counterparts (NP versus externalizing, t(174) = 4.70, Cohen’s d = 0.71, 95% CI = [0.41, 1.01], P < 0.001; NP versus internalizing, t(169) = 3.85, Cohen’s d = 0.59, 95% CI = [0.29, 0.89], P < 0.001).
As previous findings have suggested that heterogeneous regions of the same psychiatric disorder might be linked in a common brain network16, we next investigated whether the three cross-disorder factors may also share common network configurations (Fig. 4b, 55 networks in total). We found that 20 networks were predominantly associated with the general neural factor, primarily consisting of connections with the superior medial frontal (SMF) network (Supplementary Table 10a). In addition, 18 networks were predominantly associated with the externalizing neural factor, mainly encompassing connections with the motor areas networks (Mot) (Supplementary Table 10b). Moreover, 17 networks were predominantly associated with the internalizing neural factor, primarily connected to the default mode network (DMN) (Supplementary Table 10c). However, at the network level, we observed indifferentiable specificity scores among the three cross-disorder networks (F(254) = 0.18, partial η2 = 0.007, 95% CI = [0.000, 0.024], P = 0.83). In summary, our findings indicated that the general and stratified factors exhibited increased neural specificity along the neuroanatomical coarse–fine gradient from regional to network level.