
Participants’ characteristics regarding perceived stress, psychological flexibility, interpretation biases, and mental health outcomes
At baseline, participants reported a moderate level of perceived stress (M = 49.53; SD = 23.58; observed range: 0–95), which increased at follow-up (M = 59.42; SD = 21.18; range: 0–100; t(227) = − 5.58, p t(227) = − 1.00; p = 0.320) and its mean did not exceed the cut-off of ≥ 24 (MT0 = 20.20, SD = 9.43; MT1 = 20.63, SD = 8.73; range at both time points: 7–46). Participants’ endorsements of positive interpretations (M = 19.69; SD = 3.97; range: 7–29) was higher than those of negative interpretations (M = 17.30; SD = 3.31; range: 6–29). A paired sample t-test confirmed that this difference was statistically significant (t(227) = 4.87; p
For both time points, self-reported depression (MT0 = 4.78, SD = 4.20; rangeT0: 0–20; MT1 = 5.04, SD = 4.14; rangeT0: 0–18; t(227) = − 1.25; p = 0.213) and anxiety symptoms (MT0 = 3.77, SD = 3.60; rangeT0: 0–15; MT1 = 3.73, SD = 3.45; rangeT0: 0–14; t(227) = 0.23; p = 0.817) were slightly above the cut-off for mild symptom occurrence. Stress-related symptoms were beneath the recommended cut-off of > 7 (MT0 = 6.41, SD = 4.06; rangeT0: 0–18; MT1 = 6.89, SD = 4.20; rangeT0: 0–18) and increased significantly from baseline to follow-up (t(227) = − 2.06; p MT0 = 18.45, SD = 5.10; MT1 = 18.36, SD = 5.10; range for both time points: 4–27) and remained stable across assessment times (t(227) = 0.40; p = 0.691).
Correlations between perceived stress, psychological flexibility, interpretation biases, and mental health outcomes
Correlations between perceived stress, psychological flexibility, interpretation biases, and mental health outcomes (i.e., depression, anxiety, stress, and positive mental health) for the moderate-stress phase (T0) can be found in Table 1.
Table 1 Correlations between perceived stress, psychological flexibility, interpretation biases, and mental health outcomes at T0 (moderate stress phase).
Perceived stress was neither correlated to positive nor to negative interpretation biases (rs ≥ − 0.038; ps ≥ 0.566), but it was significantly correlated to psychological flexibility (r = 0.135; p = 0.041), anxiety (r = 0.235; p r = 0.275; p r = − 0.162; p = 0.014). Positive and negative interpretation biases correlated significantly with psychological flexibility (rpositive = − 0.351, p rnegative = 0.419; p rspositive ≤ − 0.222, ps rsnegative ≥ 0.275; ps rpositive = 0.410, p rnegative = − 0.349; p rs ≥ 0.639; ps r = − 0.726; p
Table 2 shows correlations between perceived stress, psychological flexibility, interpretation biases, and mental health outcomes for the high-stress phase (T1).
Table 2 Correlations between perceived stress, psychological flexibility, interpretation biases, and mental health outcomes at T1 (high stress phase).
Overall, the pattern of associations was largely comparable across time points. Notable exceptions emerged for the significant (but small) correlations between negative interpretation biases and perceived stress at T1 (r = 0.141; p = 0.034) and between perceived stress and depression symptoms at T1 (r = 0.195; p = 0.003). These correlations were not significant at T0. In addition, the association between perceived stress and psychological flexibility was more pronounced at T1 (r = 0.251; p r = 0.135; p = 0.041). These findings provide preliminary indication that the links between stress and related variables become more pronounced under heightened stress conditions.
Moderated mediation for the moderate stress phase (T0)
The models assessed the mediating role of psychological flexibility in the relationship between perceived stress and mental health outcomes (depression, anxiety, stress-related symptoms, positive mental health) during the moderate stress period (T0). Baseline positive and negative interpretation biases were entered jointly as moderators. As the a-path (perceived stress → psychological flexibility, with interpretation biases serving as the moderators) applied to all mental health outcomes, results of these models will be reported first.
Detailed results can be found in Table 3.
Table 3 Regression results for the a-path at T0 (moderate stress phase).
As can be seen, neither the positive (b = 0.011, p = 0.189, ΔR2 = 0.009, bootstrapped CI [− 0.006, 0.026]) nor the negative interpretation bias (b = 0.013, p = 0.067, ΔR2 = 0.015, bootstrapped CI [− 0.002, 0.025]) moderated the path between perceived stress and psychological flexibility at T0.
Depression symptoms
Both interpretation biases did not significantly moderate the b- (for negative biases: b = 0.005, p = 0.524, ΔR2 = 0.001, bootstrapped CI [− 0.008, 0.019]); for positive biases: b = − 0.002, p = 0.832, ΔR2 CI [− 0.017, 0.015]) or c’-path (for negative biases: b = − 0.003, p = 0.191, ΔR2 = 0.005, bootstrapped CI [− 0.009, 0.002]); for positive biases: b = 0.001, p = 0.771, ΔR2 CI [− 0.004, 0.006]). Complete regression results can be found in Table 4.
Table 4 Regression results for the b- and c’-path at T0 (moderate stress phase).
Given that interpretation biases did not emerge as significant moderators for any model paths, process model 4 (mediation-only model) was employed to examine whether psychological flexibility was a significant mediator for the association between perceived stress and depression symptoms. Results revealed a significant indirect effect of stress on depression through lower levels of flexibility (b = 0.018, bootstrapped CI [0.004, 0.033]), providing evidence for a mediation.
Anxiety symptoms
Both interpretation biases did not significantly moderate the b- (for negative biases: b = 0.001, p = 0.845, ΔR2 CI [− 0.010, 0.013]); for positive biases: b = − 0.006, p = 0.368, ΔR2 = 0.002, bootstrapped CI [− 0.018, 0.007]) or c’-path (for negative biases: b = − 0.001, p = 0.450, ΔR2 = 0.001, bootstrapped CI [− 0.005, 0.003]); for positive biases: b = − 0.002, p = 0.349, ΔR2 = 0.002, bootstrapped CI [− 0.006, 0.003]). Complete regression results can be found in Table 4.
Process model 4 was used to examine whether psychological flexibility was a significant mediator for the association between perceived stress and anxiety symptoms. Results revealed a significant indirect effect of stress on anxiety through lower levels of flexibility (b = 0.014, bootstrapped CI [0.003, 0.026]), providing evidence for a mediation effect.
Stress-related symptoms
Both interpretation biases did not significantly moderate the b- (for negative biases: b = 0.005, p = 0.513, ΔR2 = 0.002, bootstrapped CI [− 0.009, 0.020]); for positive biases: b = − 0.001, p = 0.891, ΔR2 CI [− 0.016, 0.015]) or c’-path (for negative biases: b = − 0.001, p = 0.729, ΔR2 CI [− 0.007, 0.005]); for positive biases: b = 0.001, p = 0.717, ΔR2 CI [− 0.005, 0.008]). Complete regression results can be found in Table 4.
Process model 4 was used to examine whether psychological flexibility was a significant mediator for the association between perceived stress and stress-related symptoms. Results revealed a significant indirect effect of stress on stress-related symptoms through lower levels of flexibility (b = 0.016, bootstrapped CI [0.003, 0.030]), providing evidence for a mediation effect.
Positive mental health
Regarding the b-path, negative interpretation biases moderated the link between psychological flexibility and positive mental health (b = 0.018, p = 0.045, ΔR2 = 0.012, bootstrapped CI [0.0002, 0.033]). No other interactions were significant (for the b-path and positive biases: b = 0.011, p = 0.458, ΔR2 = 0.004, bootstrapped CI [− 0.013, 0.034]; for the c’-path and negative biases: b = 0.002, p = 0.538, ΔR2 CI [− 0.003, 0.008]); for the c’-path and positive biases: b = 0.002, p = 0.571, ΔR2 = 0.001, bootstrapped CI [− 0.005, 0.010]). Complete regression results can be found in Table 4.
Given the significant interaction between psychological flexibility and negative interpretation biases, process model 14 (moderated mediation with a moderated b-path) was used for further examination. Contrary to the results above, the index of moderated mediation (b = 0.001) was not significant as the bootstrapped CI included zero (− 0.0001, 0.002). Thus, negative interpretation biases did not significantly moderate the b-path in this model. As with mental health symptoms, results did only provide support for a mediation effect of perceived stress on positive mental health through lower psychological flexibility, as evidenced by the significant indirect effect in model 4 (b = − 0.021, bootstrapped CI [− 0.038, − 0.004]).
Moderated mediation for the high stress phase (T1)
The models assessed the mediating role of psychological flexibility in the relationship between perceived stress and mental health outcomes (depression, anxiety, stress-related symptoms, positive mental health) during the high stress period (T1). Baseline positive and negative interpretation biases were entered jointly as moderators. Similarly to the models for T0, the a-path applied to all mental health outcomes, which is why results of these models will be reported first.
Detailed results can be found in Table 5. As can be seen, neither the positive (b = − 0.006, p = 0.557, ΔR2 = 0.002, bootstrapped CI − 0.024, 0.014]) nor the negative interpretation bias (b = − 0.009, p = 0.316, ΔR2 = 0.005, bootstrapped CI [− 0.021, 0.011]) moderated the path between perceived stress and psychological flexibility at T1.
Table 5 Regression results for the a-path at T1 (high stress phase).Depression symptoms
Regarding the b-path, negative interpretation biases moderated the link between psychological flexibility and depression symptoms (b = 0.020, p = 0.001, ΔR2 = 0.023, bootstrapped CI [0.008, 0.032]). No other interactions were significant (for the b-path and positive biases: b = 0.010, p = 0.164, ΔR2 = 0.004, bootstrapped CI [− 0.005, 0.024]; for the c’-path and negative biases: b = 0.002, p = 0.430, ΔR2 = 0.001, bootstrapped CI [− 0.004, 0.007]); for the c’-path and positive biases: b = 0.001, p = 0.828, ΔR2 CI [− 0.006, 0.006]). Complete regression results can be found in Table 6.
Table 6 Regression results for the b- and c’-path at T1 (high stress phase).
Given the significant interaction between psychological flexibility and negative interpretation biases, process model 14 was used for further examination. The index of moderated mediation was significant, providing evidence for a moderating role of negative interpretation biases on the psychological flexibility-depression link at T1 (b = 0.001, bootstrapped CI [0.0003, 0.003]). Follow-up analyses revealed that the effect of reduced psychological flexibility on depression scores was strongest for high negative interpretation bias values (b = 0.346, p CI [0.290, 0.402]), it was lower for medium interpretation biases (b = 0.279, p CI [0.224, 0.333]), and lowest (but still significant) for low interpretation biases (b = 0.211, p CI [0.126, 0.296]). Based on the Johnson-Neyman method, results indicated that for negative interpretation biases below ≤ –2.6 SD, the conditional effect of psychological flexibility on depression was no longer significant. Moderated effects for the b-path are shown in Fig. 2.
Fig. 2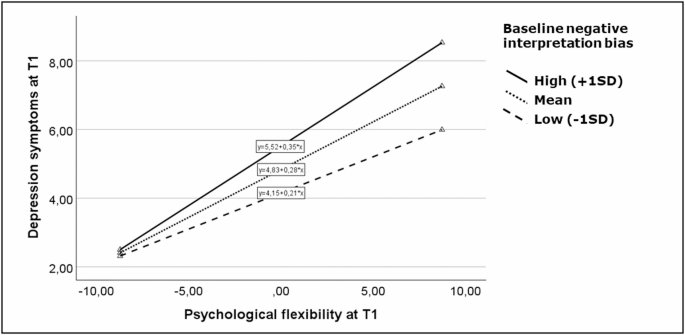
Association between psychological flexibility on depression symptoms in the high stress phase (T1) at low, medium, and high baseline values of negative interpretation bias. Variables are mean-centered. Psychological flexibility was measured with the Acceptance and Action Questionnaire II (AAQ-II 49), where low values represent high psychological flexibility.
The complete moderated mediation model for depression symptoms is presented in Fig. 3.
Fig. 3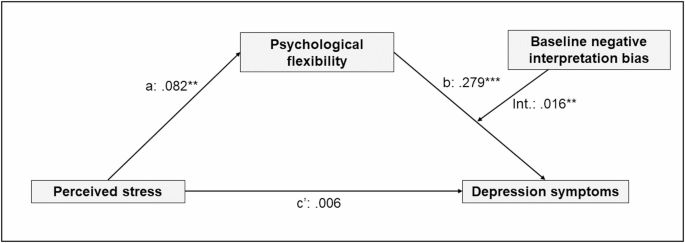
Moderated mediation model for the link between perceived stress on depression through psychological flexibility in the high stress phase, moderated by baseline negative interpretation biases. Results are based on process model 14 (moderated mediation model with a moderated b-path); *p p p
Anxiety symptoms
Both interpretation biases did not significantly moderate the b- (for negative biases: b = 0.004, p = 0.494, ΔR2 = 0.001, bootstrapped CI [− 0.007, 0.015]); for positive biases: b = 0.005, p = 0.463, ΔR2 = 0.001, bootstrapped CI [− 0.007, 0.018]) or c’-path (for negative biases: b = 0.002, p = 0.392, ΔR2 = 0.002, bootstrapped CI [− 0.003, 0.007]); for positive biases: b = − 0.002, p = 0.602, ΔR2 = 0.001, bootstrapped CI [− 0.008, 0.005]). Complete regression results can be found in Table 6.
Process model 4 was used to examine whether psychological flexibility was a significant mediator for the association between perceived stress and anxiety symptoms. Results revealed a significant indirect effect of stress on anxiety through lower levels of flexibility (b = 0.020, bootstrapped CI [0.007, 0.034]), providing evidence for a mediation effect.
Stress-related symptoms
Both interpretation biases did not significantly moderate the b- (for negative biases: b = 0.011, p = 0.091, ΔR2 = 0.007, bootstrapped CI [− 0.002, 0.032]); for positive biases: b = 0.010, p = 0.166, ΔR2 = 0.004, bootstrapped CI [− 0.005, 0.023]) or c’-path (for negative biases: b = 0.001, p = 0.764, ΔR2 CI [− 0.004, 0.008]); for positive biases: b p = 0.416, ΔR2 CI [− 0.005, 0.007]). Complete regression results can be found in Table 6.
Process model 4 was used to examine whether psychological flexibility was a significant mediator for the association between perceived stress and stress-related symptoms. Results revealed a significant indirect effect of stress on stress-related symptoms through lower levels of flexibility (b = 0.023, bootstrapped CI [0.008, 0.039]), providing evidence for a mediation effect.
Positive mental health
Both interpretation biases did not significantly moderate the b- (for negative biases: b = 0.011, p = 0.177, ΔR2 = 0.005, bootstrapped CI [− 0.005, 0.027]); for positive biases: b = 0.010, p = 0.338, Δv = 0.003, bootstrapped CI [− 0.010, 0.030]) or c’-path (for negative biases: b = − 0.002, p = 0.618, ΔR2 = 0.001, bootstrapped CI [− 0.008, 0.005]); for positive biases: b p = 0.750, ΔR2 CI [− 0.010, 0.007]). Complete regression results can be found in Table 6.
Process model 4 was used to examine whether psychological flexibility was a significant mediator for the association between perceived stress and positive mental health. Results revealed a significant indirect effect of stress on mental health through lower levels of flexibility (b = − 0.029, bootstrapped CI [− 0.050, 0.010]), providing evidence for a mediation effect.