
A total of 523 families (n = 983 participants) were enrolled (Table 1, Fig. 1). Rates of questionnaire completion and loss to follow-up, for both children and parents, are presented in the flow diagram (Fig. 2). From baseline to T2, the dropout rate was 59.1% (309/523). The patients (340 males and 183 females) had a mean age of 12.8 years (SD = 2.9). At baseline, 34.4% (n = 172) were attending primary school, 31.2% (n = 156) in lower secondary school, and 34.4% (n = 172) upper secondary school.
Fig. 1: Recruitment by study site and geographic distribution of participants families.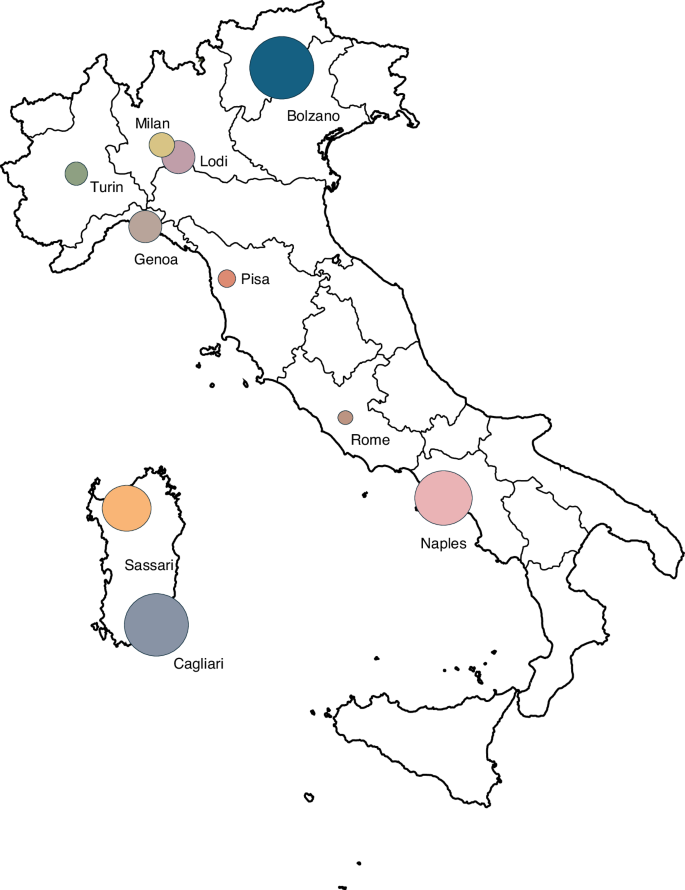 The alternative text for this image may have been generated using AI.
Circle size is proportional to the number of enrolled families at each site.
Fig. 2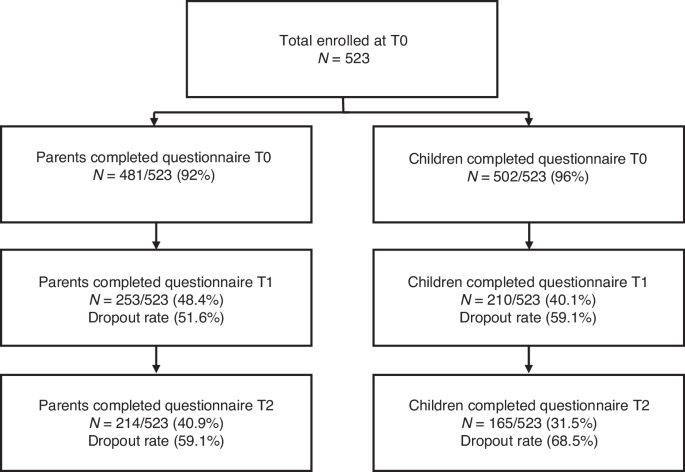 The alternative text for this image may have been generated using AI.
The flow diagram shows the number of subjects who completed the questionnaires at the three selected time points.
Table 1 Distribution of participating families by study site in Italy (n = 523).
Most (53.5%, n = 272) lived in urban areas, 38.0% (n = 193) in suburban, and 8.3% (n = 42) in rural areas. SES was available for 462 families. Socio-demographic characteristics are shown in Table 2.
Table 2 Baseline demographic and clinical characteristics of the study patients.
Based on the 3 diagnostic categories, 30.1% of the patients (n = 152) had an internalizing disorder, 58.8% (n = 297) an externalizing disorder, and 11.1% (n = 56) other disorders (Table 3). Furthermore, 48.6% (n = 254) had only one psychiatric diagnosis, while the remaining 51.4% (n = 269) had at least another comorbid disorder.
Table 3 Primary clinical diagnoses and diagnostic categories.
At baseline, 9.2% (n = 48) were receiving pharmacotherapy, 25.4% (n = 133) non-pharmacological treatment, 41.3% (n = 216) both pharmacological and non-pharmacological interventions, and 108 (20.6%) no specific intervention. Data about treatment were unavailable for 18 children (3.4%).
Exploratory factor analysis and confirmatory factor analysisParents sample
In the parents’ subsample, the explorative factor analysis (EFA) with oblique rotation (promax) was conducted on 20 items of the questionnaire. The graphical criterion based on the scree-plot and the results of the parallel analysis40 suggested a factorial structure defined by 3 factors (see Fig. S1 and Table S1 for eigenvalues and Table S2 for factor loadings after rotation in online Supplementary Materials). The items included in the factor analysis for parents’ report are underlined in Appendix A.
Three factors had eigenvalues over Kaiser’s criterion of 1 and, in combination, explained 36.1% of the total variance. The items that loaded strongly on the same factors suggest the following interpretations: Factor 1 (Child Emotionality) captures parents’ perceptions of their child’s emotional and psychological states; Factor 2 (Parent Emotionality) reflects parents’ own emotional responses and psychological adjustments; and Factor 3 (Child Concerns) represents the parents’ observations of their child’s specific worries and fears (see Table S2, in online Supplementary Materials).
A further CFA confirmed the three-factor structure, consistent with the results of the EFA (see Table S4 and S5 in online Supplementary Materials).
Children/adolescents sample
In the children/adolescents’ first subsample, an explorative factor analysis (EFA) with oblique rotation was conducted on the 17 items. The EFA identified four factors with eigenvalues greater than 1, explaining 41.2% of the total variance (see Fig. S2 for scree-plot, Table S6 for eigenvalues and Table S7 for factor loadings in online Supplementary Materials). The items included in the factor analysis for the child report are indicated by underlining in Appendix B.
Four factors were retained in the final analysis and were interpreted as follows: Factor 1 (Child/Adolescent Emotionality) reflects the emotional well-being and psychological states of children/adolescents, including happiness, anxiety, sleep quality, and agitation; Factor 2 (Mental Health Support) captures the perception of changes in the quality and quantity of mental health services and satisfaction with such support; Factor 3 (Child/Adolescent Behavior) represents behavioral difficulties, such as irritability, aggression (both exhibited and experienced), and challenges in self-regulation; and Factor 4 (Child/Adolescent Concerns) encompasses specific worries, particularly those related to health and contagion risks.
In the subsequent Confirmatory Factor Analysis (CFA) (carried out in the second subsample) the four-factor model identified from the previous EFA was confirmed, demonstrating alignment with the results of the explorative approach (see Tables S8 and S9 in online Supplementary Materials).
Correlation with sociodemographic characteristics
The factors at all time points were also correlated with age and SES. Correlation analyses were performed for both parent and adolescent groups using the non-parametric Spearman’s Rho coefficient. Within the parent questionnaire, no significant correlation between the child’s age and any factor was found. A higher SES was associated with better emotional well-being in children/adolescents, measured by the “Child Emotionality” factor, in both 2020 (T0: Rho = −0.197, p = 0.001) and 2021 (T1: Rho = 0.141, p = 0.034), with a progressively decreasing correlation coefficient, indicating a weakening of the relationship between the two variables. This correlation disappeared entirely in 2022. In contrast, the “Parent Emotionality” factor correlated with SES at all time points showing a stronger correlation in 2022 compared to previous years (T0: Rho = −0.100, p = 0.037; T1: Rho = −0.134, p = 0.045; T2: Rho = −0.230, p = 0.001). A higher SES was also significantly associated with lower parent-reported Child Concerns, but only in 2021 (T1: Rho = −0.156, p = 0.019).
In the patients’ questionnaire, older adolescents reported a more positive perception of mental health services (T0: Rho = 0.142, p = 0.002); this relationship was present only in 2020 but not in 2021 or 2022.
Similarly to the findings in parents, a significant correlation was observed between SES and the “Child Emotionality” factor in both 2020 (T0: Rho = −0.101, p = 0.032) and 2021 (T1: Rho = −0.155, p = 0.033), while no correlation was found in 2022: higher SES was associated with greater emotional and psychological well-being as self-reported by adolescents. A significant association between SES and behavioral difficulties and self-regulation challenges emerged only in 2021, with participants from higher socioeconomic backgrounds exhibiting fewer behavioral problems and better self-regulatory capacities (T1: Rho = −0.155, p = 0.033).
Linear mixed-model analysis on parent survey
To examine the effects of psychological and contextual variables on the outcome across the three time points, we employed Linear Mixed-Effects Models (LMMs) using restricted maximum likelihood estimation (REML). Given the hierarchical structure of the data—with repeated measures nested within individuals—a random intercept was specified for participant ID to account for within-subject dependencies.41
Model evaluation and selection: in the initial phase, we evaluated a model that included a random intercept for the geographic area of residence, in addition to the participant-level intercept. However, this more complex model did not improve model fit over the simpler model with participants as the sole random effect (χ²(1) = 0.00, p = 1.00), and the variance component for area was estimated as zero. Therefore, the area random effect was excluded from the final model in favor of parsimony and to avoid overparameterization. This decision was also supported by model comparison metrics (ΔAIC = +2.0), indicating no benefit in retaining the additional random term.
Final model specification: the fixed effects in the final model included: time (2020, 2021, 2022), questionnaire psychological factor (Child Emotionality, Parent Emotionality, Child Concerns), SES (treated as ordinal), diagnostic category (treated as categorical), parental participation at baseline, area of residence, age (standardized), the interaction between questionnaire psychological factor and SES. The random intercept was specified for each participant. The final model demonstrated satisfactory convergence, and no issues related to multicollinearity or singularity were identified. Residual diagnostics suggested acceptable model fit. The statistical modeling workflow is reported in Appendix Parents. No significant effects were found for time, diagnostic category, parental participation at T0, and area of residence, suggesting that these variables did not meaningfully contribute to variation in the outcome in this model. However, although SES plays a significant role overall, its influence is attenuated in the context of Child Concerns (Table 4; Fig. 3).
Fig. 3: Model-predicted factor scores across SES levels (parent report).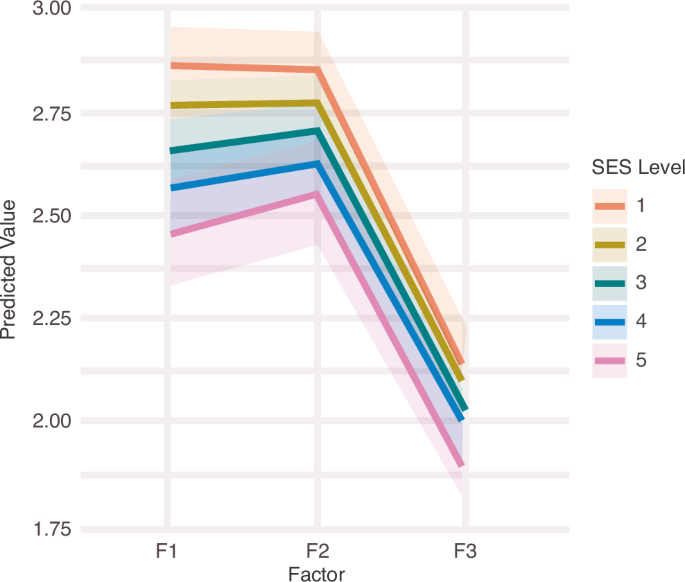 The alternative text for this image may have been generated using AI.
Lines show model-predicted scores for each factor across socioeconomic status (SES) levels (1 = low to 5 = high). Factors were defined as F1 = Child Emotionality, F2 = Parent Emotionality, and F3 = Child Concerns. Scores were slightly higher (indicating greater impairment) at lower SES levels and slightly lower at higher SES levels, although differences were small. Child Emotionality and Parent Emotionality did not differ substantially from each other, whereas Child Concerns showed markedly lower scores than the other factors.
Table 4 Linear mixed-effect model: parent-reported measures fixed effect.
Although area of residence was initially considered as a hierarchical level, its contribution was found to be negligible and excluded to retain a parsimonious model.
Linear mixed-model analysis on child/adolescent survey
In parallel with the procedure applied in the parent sample, to evaluate the criterion validity of the factor scores within the child-report sample, we conducted linear mixed-effects models (LMMs) to examine changes over time, differences among factor types, and the role of covariates including SES, clinical characteristics, and parental participation. The model accounted for repeated measures within individuals and recruitment center clustering.
Model selection and specification
Model comparison procedures were conducted using likelihood-ratio tests (LRT) under Maximum Likelihood (ML) estimation to determine the optimal random-effects structure and the necessity of including interaction terms.
Final model specification
The final model included random intercepts and random slopes for time at the individual level, random intercepts for center (Cat_site); the fixed effects included factors (Child Emotionality, Mental Health Support, Child Behavior, Child Concerns), time, SES, age (scaled), parental participation at baseline, diagnostic category, and area of residence; an interaction term between factor and SES level, based on theoretical and empirical grounds.
Model comparisons confirmed the appropriateness of including random slopes for time (ΔAIC = –6.5, p = 0.0049), while the inclusion of the factor × SES interaction improved model fit, albeit marginally (ΔAIC = –4.4, p = 0.075), thus retained for interpretive purposes (See Appendix Children).
No significant changes were detected over time at the group level, and neither age, diagnostic category, nor area of residence were significant predictors in this model. The Mental Health Support factor was associated with significantly higher scores, while Child Behavior and Child Concerns related to Covid-19 infection were consistently lower than the Child Emotionality factor. SES showed a strong main effect, with children from intermediate SES levels (2–4) scoring significantly lower indicating a better psychological condition (Table 5). Significant interaction effects emerged for the Mental Health Support factor with SES levels 2, 3, and 4, indicating that the expected SES gradient was less pronounced for this factor (Table 6).
Table 5 Linear mixed-effect model: child-reported measures fixed effects.Table 6 Interaction effects between factor and socioeconomic status (SES) in the child-reported model.
A similar pattern was observed for the Child Concerns × SES interaction: children in lower SES still scored significantly lower (better perceived mental health support) though this was moderated slightly by the interaction term. The plot of estimated marginal means (EMMs) shows diverging SES trajectories across factors: Mental Health Support demonstrates relative SES invariance (flat lines across SES levels), Child Behavior and Child Concerns factor show steeper gradients, consistent with SES sensitivity (Fig. 4).
Fig. 4: Model-predicted factor scores across SES levels (Child report).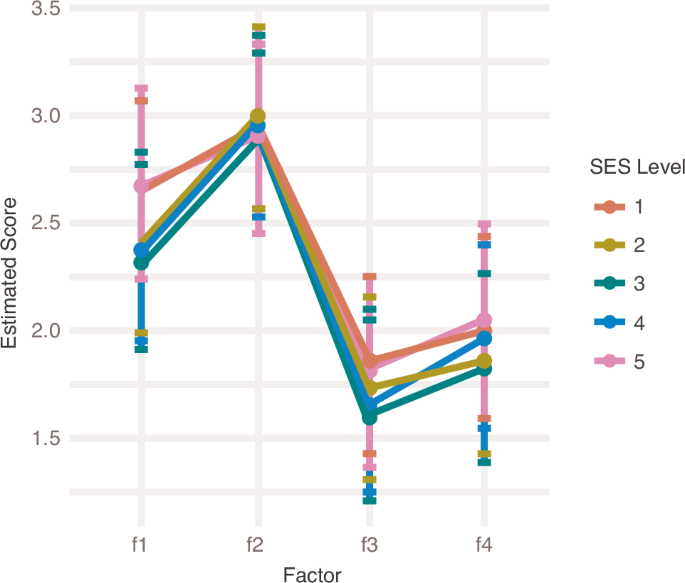 The alternative text for this image may have been generated using AI.
Lines show model-predicted scores for each factor across socioeconomic status (SES) levels (1 = low to 5 = high). Factors were defined as F1 = Child Emotionality, F2 = Mental Health Support, F3 = Child Behavior, and F4 = Child Concerns. Although modest, a factor-by-SES interaction was observed for Child Emotionality and Child Behavior, whereas predicted scores largely overlapped across SES levels for Mental Health Support. Overall, Child Emotionality scores were higher than those for Child Concerns and Child Behavior.
Random-effect individual variability was considerable. In particular, inter-individual variability in time-related change was virtually negligible in 2021, but became more evident in 2022, indicating meaningful between-subject heterogeneity in longitudinal trajectories despite the lack of a significant group-level mean change over time.
The contribution of center-level clustering was low but retained to account for site-specific recruitment variability. The small but non-zero center variance supports model specification that includes center as a random effect.